 Climate change, to the extent that such a thing exists, only matters if it is significant enough to affect humans or ecosystems. And even if it does exist, there is no way to know how much is natural versus human-induced. Contrary to popular belief, there are no �fingerprints� of anthropogenic global warming.
There is no question that weather variations affect us all. And there is no question that in certain regions, there can be multi-decadal changes which, as far as we know, have always occurred from time to time: e.g. Alaska warmed up in the late 1970s, and has mostly remained warm since. The Sahelian drought lasted decades�then went away. The Medieval and Roman Warm Periods were good for human prosperity.
Large year-to-year changes in weather are particularly common. Please don�t bore me with claims they are the fault of Exxon-Mobil.
Yet we are now wringing our hands over current temperatures which are arguably no different than during previous periods of human progress and abundance, 1,000 and 2,000 years ago. Even a modern Methuselah wouldn’t be old enough to remember back that far.
Hubert Lamb, who founded the UK�s Climatic Research Unit in 1972, had the proper perspective on climate, a perspective that is sorely lacking in the new crop of climate researchers who anthropomorphize everything they see in nature. Lamb�s books on past (natural) climate change show how humans have been affected by what I call �climate chaos� throughout the centuries and millennia.
Now to the point of this post: With huge variations in temperature or precipitation being the norm for most life on the planet, would anyone have noticed �climate change� if not for thermometer records which (after much fiddling) researchers have extracted warming trends so small that no one alive would ever notice? I doubt it.
Those who �see climate change out their window� apparently can�t separate their emotional response to weather events (which there is no long term change in) with real long-term change, which can�t be observed by humans looking out their windows.
Our satellite systems can monitor global temperature changes to hundredths of a degree. Interesting, but mostly irrelevant to life on Earth. Warming of the deep oceans, if it is even occurring, is only thousandths of a degree.
The satellite microwave radiometers that have been flying since 1979 have seen Arctic sea ice decreases, but Antarctic sea ice increases, with the global sea ice now running close to the long-term average. Would we even notice this if not for satellites?
We can measure change in the CO2 content of the air to better than 1 part in a million�but the increase in CO2 in the last 100 years amounts to only 1 part in 10,000. Does our precision with which we can measure change determine the significance of the change to life on Earth?
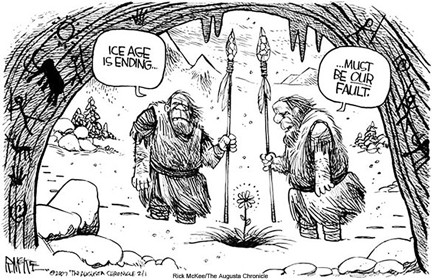
Admittedly, most glaciers have been seen to be retreating. But that�s been happening for at least 150 years, which is before humans can be blamed. Some of the retreating glaciers in Europe, Canada, and Alaska are revealing tree stumps�evidence of past warmth greater than the most recent centuries which similarly cannot be blamed on humans.
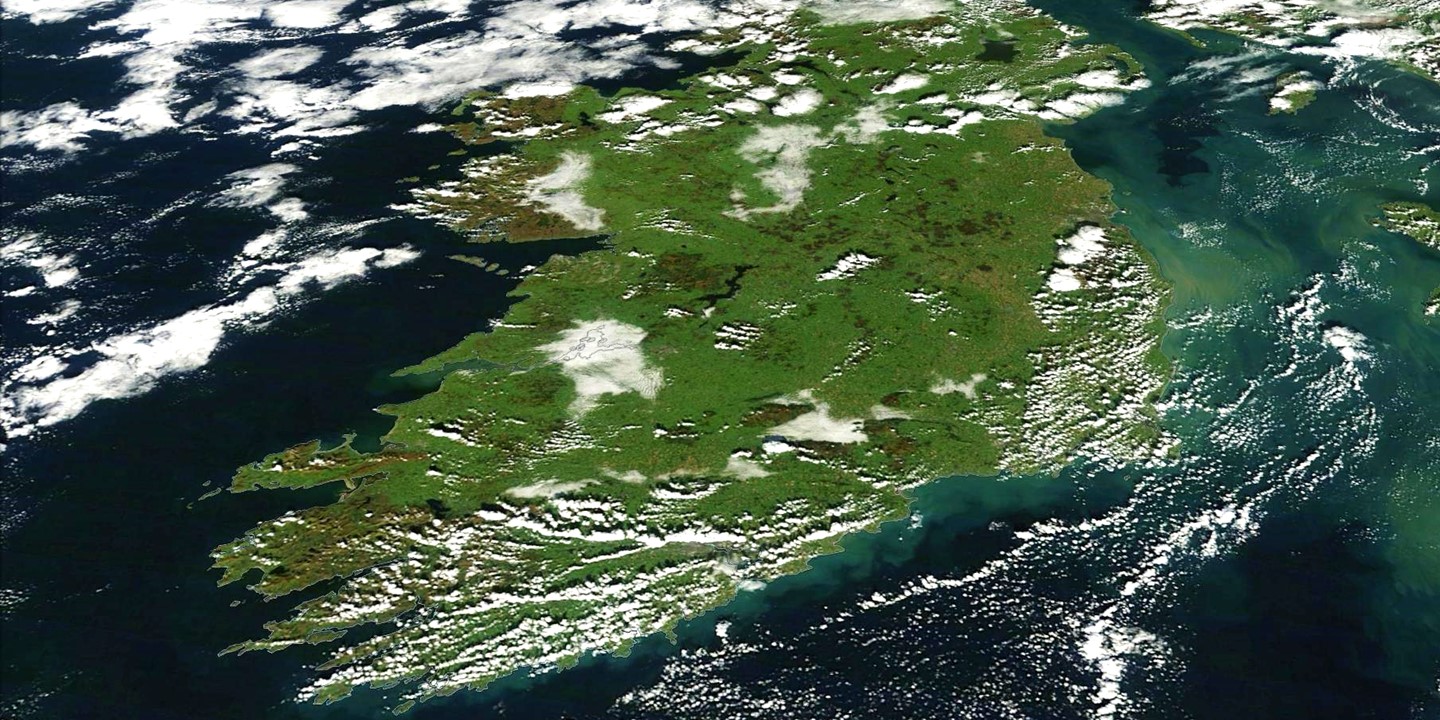
And why do we assume all change is �bad�? There has been a documented greening of the Earth due to modest warming, and especially to that 1 part in 10,000 increase in the life-giving gas, carbon dioxide.
I�m sure you can find parallels in a variety of environmental pollutants that technology has allow us to measure to infinitesimal levels of precision. This inspires the EPA to regulate pollutants to ever-decreasing levels which reduces prosperity, destroy jobs, and will likely cause more harm than good.
This seems to be the fate of our advanced society — we must find increasingly obscure things to fret over as we solve our major problems�hunger, disease, water-borne illness, infant mortality. But with real problems now appearing � renewed terrorist threats, Ebola — I fear we are straining gnats as we swallow camels.

 Home/Blog