Crazy Man to Live on Iceberg for 1 Year

August 24th, 2014

sheldon-iceberg
I suppose this was inevitable.

An adventurer who has rowed solo across oceans and jogged a total of 4 lightyears is going to bring attention to global warming (what’s that?) by living on a Greenland iceberg for up to a year starting next Spring.

As reported by TreeHugger.com, Alex Bellini, a “professional adventurer” from Italy, will chronicle the melting of the iceberg (which, of course, never happened in summer before humans began burning fossil fuels).

For those new to how high-quality science works, Mr. Bellini explains in his own words (emphasis mine):

My objective is reporting and investigating, by means of scientific methods, the entire lifetime of an iceberg. I want to prove how the pace of ice-melting has dramatically accelerated over the last decades.

How exactly he is going to do that by sitting on an iceberg as it melts in the summer, which is what icebergs do anyway, remains to be seen.

The sad part is the number of people who will fall for this. Probably including Mr. Bellini himself. Pure publicity stunt, no scientific value whatsoever.

I guarantee you if he does camp out on an iceberg, he will not stay there a year. Greenland winters are brutal.

Censorship Alive and Well at Wikipedia

August 21st, 2014

propaganda-ministryThat didn’t take long. Less than 24 hours after I noted the use of the “97% of scientists agree” meme as an example of “propaganda techniques” on Wikipedia, the example has disappeared.

But “Hope and Change” remains there as an example of Ad Nauseum propaganda. Time to scrub that one, too?

The Global Warming Ice Bucket Challenge

August 20th, 2014

ice-bucket-challengeThis ALS ice bucket challenge thing seems to be very successful in raising money for ALS research.

Or is it raising awareness? Im not sure. Maybe both.

I think its now time to raise awareness of global warming. After all, if we didnt tell people about it, they would never know, right? We would instead have to actually experience global warming ourselves, rather than measure alleged temperature changes of tenths of a degree over a period of 50 years.

So, you have two choices. Either (1) pour a bucket of ice water over your head, which will require the wasting of the extra energy needed to freeze the water thereby making global warming even worse, or (2) donate $100 to Greenpeace to help make sure millions of poor people cant avoid blindness or death by having access to Golden Rice.

Oh, wait. Maybe thats not such a good idea

How about donate $100 to your favorite mainstream media outlet, since they are having so much trouble convincing the public that Al Gore was right about Manbearpig after all?

Or donate the $100 to Al Gore directly, since he is allegedly being cheated out of millions of dollars of Big Oil money from his sale of Current TV to Al Jazeera. Poor guy. 🙁

So, show everyone you care about global warming! Dump some ice water on your head!

(But don’t use any from the Arctic Ocean! There’s almost none left there anyway!)

Humanity is depending on you!

Wikipedia Page on Propaganda Techniques Uses 97% Meme

August 20th, 2014

If 99 billion mouths agree, shouldn't you?

If 99 billion mouths agree, shouldn’t you?


Oh, this is too rich.

I’ve blogged before on how global warming alarmists use all of the standard propaganda techniques to convince the not very super-sophisticated masses, and I listed Al Gore’s own statements as examples.

Well, it turns out the “97% of all scientists agree on global warming” meme is being used as an example on the Wikipedia Propaganda Techniques page:

Bandwagon

Bandwagon and “inevitable-victory” appeals attempt to persuade the target audience to join in and take the course of action that “everyone else is taking.”

Inevitable victory: invites those not already on the bandwagon to join those already on the road to certain victory. Those already or at least partially on the bandwagon are reassured that staying aboard is their best course of action. (e.g., “The debate is over. 97% of scientist agree”)

I wonder how long the example will stay there, without William Connolly to play gatekeeper. I also see “Hope and Change” is given as an example. Hmmm…sounds vaguely familiar.

Of course, Tom Steyer’s recent claim that 99.5% of the country is not “super sophisticated” when it comes to global warming beliefs is belied by the fact that research shows the more educated you are in math and science, the more likely you are to be a skeptic.

Being super sophisticated doesn’t mean being smart.

New Orleans Hurricane Exactly 9 Years After Katrina?

August 19th, 2014

It’s still over a week away, but a tropical disturbance east of the Lesser Antilles is being forecast by the GFS model to grow into a hurricane, making landfall near New Orleans just 1 day before the 9th anniversary of Katrina’s landfall:

Nine day forecast of 850 mb circulation and temperature from the 12Z GFS model run on 19 August, 2014.

Nine day forecast of 850 mb circulation and temperature from the 12Z GFS model run on 19 August, 2014.

Needless to say, it IS hurricane season, so a Gulf of Mexico hurricane in late August (near the peak in the season) is not that unusual.

But note the 2014 season is supposed to be relatively inactive:

Of course, this far in advance, the hurricane (even if it forms) could make landfall anywhere along the Gulf coast. I just thought the timing and location, exactly 9 years after Katrina, was interesting.

Thermal Imaging with your iPhone

August 19th, 2014

This is SO cool.

FLIR Systems now has an iPhone add-on that turns your iPhone 5 or 5s into a thermal imager, for $349. (In contrast, my FLIR i7 imager was, as I recall, $2,000.)

FLIR One thermal imager back for the iPhone 5 or 5s.

FLIR One thermal imager back for the iPhone 5 or 5s.

Called the “FLIR One“, I think these are going to be pretty popular, and I’m sure the price will come down over time.

There are many uses (besides the gee whiz factor). You can see in the dark with it, see small animals in the woods, identify subtle temperature changes associated with water leaks, overloaded electrical wires, find insulation voids in your walls, air leaks around windows and doors, tell when your girlfriend or wife is really mad at you, and open up a whole new world of cat photography on Facebook.

Who knows? Maybe we will even have reports from all over the world documenting the existence of the atmospheric greenhouse effect.

Contrary to the TV series 24, though, you can’t see through solid surfaces like walls and roofs with it. You can’t even see through glass windows, which are also opaque in the infrared. But anything that subtly changes the temperature of the surface of a wall, like the presence of pipes or studs, can usually be seen.

I suspect that law enforcement and the bad guys will both be using it to gain an advantage. I won’t go into the ways in which that might happen.

The specifications for the FLIR One show pretty high sensitivity (0.18 deg. F), but a fairly restricted range of temperatures it will sense (32 to 212 deg. F). On the plus side, it also has a visible light camera and offers a visible/IR blending option for photos. It comes with its own battery, which is kept separate from the iPhone battery system.

Just to be clear…this is not an “App”…it can’t be done with just software. It has a microbolometer sensor array in it which receives infrared energy through a IR lens and measures the resulting tiny changes in temperature at each element in the array, then converts those changes to a pretty accurate estimate of temperature.

Since I recently switched from iPhone to Samsung, I’ll have to stick to my FLIR i7 imager for now. Oh well.

Climate Polling Results Lead to Weird Press Coverage

August 13th, 2014

A recent polling of Americans on their attitudes about how much scientists know (or claim to know) about global warming, as well as what should be done about it, has led to very different treatments in the press, specifically in the Pittsburgh Post-Gazette, which commissioned the poll.

The PG’s editorial take on the poll is that it shows that most Americans aren’t really that committed to the issue one way or the other. It suggests that the new poll questions were phrased in an unbiased manner (not assuming, for example, that global warming was a problem that needed to be dealt with), unlike previous polls claiming wide support for government action to reduce carbon dioxide emissions.

But the Post-Gazette also ran an op-ed by the pollster himself, who made it clear that Republicans are blind to established “facts” and only resist action on climate change because conservatives don’t like big government. The title of that op-ed made his views pretty clear: “Not a mystery why Republicans are blind (to) facts on climate change“.

The poll report itself is much less partisan in its comments — despite being authored by the same pollster!

The bipolar treatment by the newspaper makes the whole issue even more confusing for the reader.

But it is an interesting observation (which is widely recognized) that conservatives tend to disbelieve the supposed “scientific consensus” on global warming, and liberals tend to embrace it. The claims of ideological bias on the part of conservatives can cut both ways, of course. I can claim that liberals only believe the science because they are in favor of big government. So there.

The point I keep trying to emphasize is that not all science is created equal. Putting a man on the moon was immensely easier than understanding what factors cause the climate system to change, and especially by how much. We know the average energy flows reasonably well; but climate change involves less than 1% changes in energy flows, and we don’t understand the system that well.

When climate models can’t even hindcast global temperature changes in the last 30-40 years — where the answer is already known — how can we rely on them for forecasts?

It isn’t rocket science…it’s actually much more difficult than that.

How deep ocean warming can “bypass the surface”

August 12th, 2014

There seems to be continuing confusion regarding how the deep ocean can warm without an observable temperature increase at the ocean surface.

I’m not talking about a change in the geothermal heat flux at the bottom of the ocean. And I’m not claiming Kevin Trenberth is right that this has actually happened in recent years. I’m just pointing out that it is theoretically possible.

The average state of the ocean, except at the highest latitudes, is warm water over cold water. So, there is normally a vertical temperature gradient, which is strongest in the tropics. I won’t go into the various processes which maintain this gradient, but if any one of those processes changes, the vertical temperature gradient can change.

For example, if there was an increase in vertical mixing alone in the ocean, the gradient would be reduced, with surface cooling and deep ocean warming.

Now, what if this increase in vertical mixing occurred at the same time as an additional surface heat source, such as IR warming due to increasing greenhouse gases? The result (conceivably) could be deep ocean warming with no surface warming, as shown in the following cartoon:

Deep ocean warming can seemingly bypass the surface if surface heating is combined with increased vertical mixing.

Deep ocean warming can seemingly bypass the surface if surface heating is combined with increased vertical mixing.

As I have posted previously, there was indeed a tiny (2%) increase in global average ocean surface winds after 1997-98 super El Nino, which seems to have recently gone away. Ocean mixing is a complicated subject, and I have no idea whether this small change in ocean winds, if real, is sufficient to cause the “Trenberth effect”.

The extra Joules didn’t actually bypass the surface layer…they were matched by a decrease in Joules extracted from the increased vertical mixing. Temperature change is the net result of a variety of energy gains and losses, and those energy fluxes can change with depth.

And for those wondering how IR heat flux, which only affects the skin of the ocean surface, can affect the deep ocean: the same is true of evaporation, which we know is a major component of the ocean’s energy budget.

Earths Response to Increasing CO2: An Example of Hormesis?

August 11th, 2014

One of the dubious assumptions undergirding the environmental movement is that the Earth was in an optimum state of health before humans arrived on the scene and screwed everything up.

But this is a religious assumptionwhich I dont have a problem with, until it is foisted on the masses as science.

The idea that everything humans do to the environment is bad is an emotional one, not scientific, especially when the pollution we are talking about (CO2) is necessary for life on Earth.

There is a concept in toxicology called hormesis, around since at least the late 1800s, which states that for many chemicals the biological response is actually positive at low doses, before it becomes negative at high doses. I spent some time last week with Ed Calabrese, who has published extensively on the hormesis concept (here is a review paper by him, which includes a discussion of how the hormesis concept got unfairly grouped in with the homeopathy movement).

For a very simple example, there is a wide variety of minerals necessary for human health in low doses, but which are toxic at high doses. Food and water are also necessary in low dosesbut will kill you in high doses.

More generally, there is also evidence that even for chemicals which are not necessary in the human body, low doses can actually make a person healthier because some level of environmental stress on the body makes the body more resilient. For example, some non-zero level of bacteria and virus exposure helps keep us healthier. Im told there has been some research that suggests that inhaling low levels of radon is beneficial..or at least benign. Physical exercise tears apart human tissue…but helps build more muscle as a response to the demands placed on the body.

The hormesis concept is anathema to regulatory organizations such as the EPA, which want to regulate pollution to infinitesimally small values, no matter how many people those regulations might kill in the process. The supposed justification is linear dose-response curves which basically assume that there is no beneficial level of a pollutant, and even that the smallest level of exposure will cause harm.

Needless to say, the possibility that low doses of many pollutants might actually be beneficial to human health would be a real paradigm changer in the regulatory community.

This is the basis of statistical epidemiological studies which claim thousands of deaths each year from exposure to benign things like Justin Biebers music.

For those who like graphs, the following cartoon shows what Im suggesting in qualitative functional form for carbon dioxide:

Hormesis-and-CO2

An Earth scientist who has not already sold his soul to the government regulation bureaucracy might legitimately ask, I wonder if some level of enrichment of atmospheric CO2 is actually a good thing for life on Earth?, as suggested by the green curve in the above graph.

The straight red line (linear dose response) is, in contrast, what is usually assumedthat any increase beyond that believed to exist before humans arrived is necessarily bad for Mother Earth.

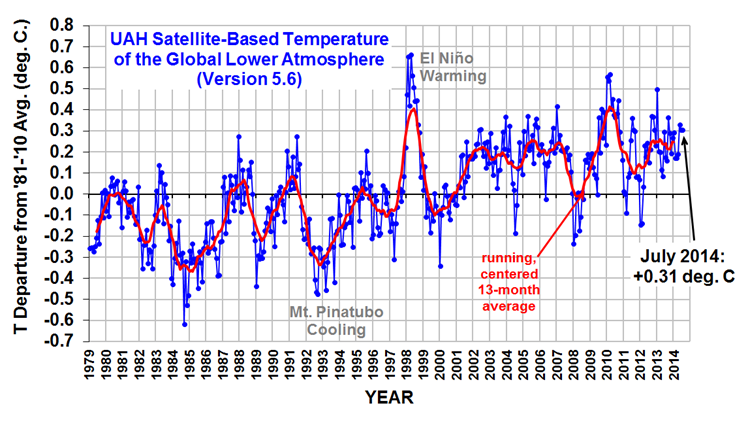
But atmospheric carbon dioxide is necessary for life on Earth, and has risen from a pre-industrial concentration of only 3 parts per 10,000, to (still only) 4 parts per 10,000 today. The result has been global greening and a moderation of global temperatures (at least partly due to more CO2, in my opinion). Theoretically expected negative impacts on severe weather and marine life have, so far, failed to reach any believable level of cause-and-effect, beyond normal natural variability.

(And if you are tempted to cite statistics of a record number of whatever events, I will ask whether humans are also responsible for the recent grand maximum record high sunspot activity out of the last 3,000 years? Was that Biebers fault, too? Or maybe Manbearpigs fault?).

Ive had plant physiologists tell me its almost as if nature has been sucking as hard as it can on atmospheric CO2, and has depleted it to the point where only the hardiest life forms can exist. But as we add more CO2 to the atmosphere, nature quickly gobbles up 50% of the extra, leading to a more luxurious and robust biosphere.

So, it is reasonable from an unbiased scientific perspective to examine the possibility that more CO2 is actually good for life on Earth…not just the biosphere, but atmospheric effects as well. After all, were not talking about X-rays herewere talking about the elixir of life, CO2.

Is there a level beyond which more carbon dioxide would be bad? Probablybut I dont think we know what that level would be. And, just to be on the safe side, if there was a way to stop producing CO2 without killing millions (if not billions) of people in the process, I might be in favor of that.

But thats simply not possible with todays energy technologies. Renewable energy sources cannot contribute to more than 15-20% of total energy demand in the coming decades, so we are stuck with fossil fuels for the time being.

I really dont care where our energy comes from, as long as it is abundant and affordable for the worlds poor. In the meantime, we need to stop thinking in simple linear dose-response terms which is contrary to so much real world experience and exists mainly to make jobs for regulators and companies that are made rich through subsides rather than through free choice by the public.

UAH Global Temperature Update for July, 2014: +0.31 deg. C

August 5th, 2014

The Version 5.6 global average lower tropospheric temperature (LT) anomaly for July, 2014 is +0.31 deg. C, unchanged from June (click for full size version):
UAH_LT_1979_thru_July_2014_v5

The global, hemispheric, and tropical LT anomalies from the 30-year (1981-2010) average for the last 19 months are:

YR MON GLOBAL NH SH TROPICS
2013 1 +0.497 +0.517 +0.478 +0.386
2013 2 +0.203 +0.372 +0.033 +0.195
2013 3 +0.200 +0.333 +0.067 +0.243
2013 4 +0.114 +0.128 +0.101 +0.165
2013 5 +0.082 +0.180 -0.015 +0.112
2013 6 +0.295 +0.335 +0.255 +0.220
2013 7 +0.173 +0.134 +0.211 +0.074
2013 8 +0.158 +0.111 +0.206 +0.009
2013 9 +0.365 +0.339 +0.390 +0.190
2013 10 +0.290 +0.331 +0.249 +0.031
2013 11 +0.193 +0.160 +0.226 +0.020
2013 12 +0.266 +0.272 +0.260 +0.057
2014 1 +0.291 +0.387 +0.194 -0.029
2014 2 +0.170 +0.320 +0.020 -0.103
2014 3 +0.170 +0.338 +0.002 -0.001
2014 4 +0.190 +0.358 +0.022 +0.092
2014 5 +0.327 +0.325 +0.328 +0.175
2014 6 +0.305 +0.315 +0.295 +0.509
2014 7 +0.306 +0.293 +0.319 +0.453

The global image for July should be available in the next day or so here.

Popular monthly data files (these might take a few days to update):

uahncdc_lt_5.6.txt (Lower Troposphere)
uahncdc_mt_5.6.txt (Mid-Troposphere)
uahncdc_ls_5.6.txt (Lower Stratosphere)