I seldom post original material by other authors, but this is one of those cases where someone I agree with has said something better than I ever could. I hope you will visit his blog.
Originally posted by Pointman on October 2, 2014
TELL ME WHY
I posed some simple questions a number of articles back and I�d like to begin this piece by asking them again, because they�re fundamental.
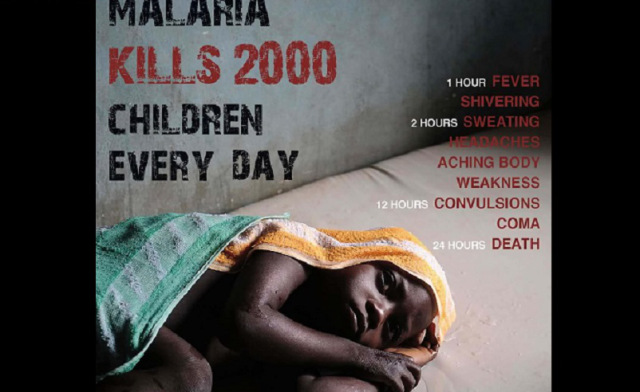
Don�t they know how many of our own poor can no longer afford to heat their homes? Don�t they know how many millions die in the developing world from malaria because we won�t allow them access to DDT? Don�t they know that a million children a year die or are simply blinded for life by withholding the distribution golden rice? Don�t they know how many lives could be saved by supplying the poor with drought and disease resistant GM seeds? Don�t they know that switching from growing food staples to growing biofuel crops for cars only the rich can afford has more than doubled prices of basic foods? Don�t they know about the people killed in the food riots? Do they actually know anything? Do they care anyway?
There�s no oily sophistry about those questions, no sophistication, no tricky debating traps, no guile, no hidden agenda but always an essential inhumanity to the silence or uneasy evasiveness with which they�re met. I�ve raised an impolite subject. The truth is people are not dying, they�re being killed and we�re the ones through inaction doing the killing. I make no apology for being so blunt because they�re needed questions, simple questions, brutal even, and yet there�s always that awkward silence in response to them.
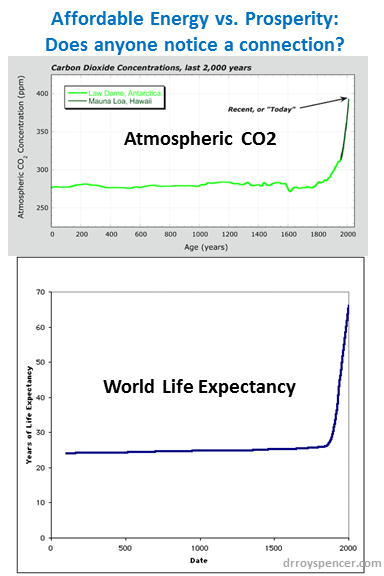
There really isn�t a party line on the moral dilemmas which are at the very heart of those questions, because morality is no longer about people or ones behaviour towards them, but simply about what�s good for the Earth or not. All else is subordinate to that consideration. In a deeper sense though, any wider altruistic morality is now about nothing more than projecting a good image of oneself rather than any notion of common humanity.
What we�re talking about are the lives of the most vulnerable being needlessly sacrificed atop a green altar, because of an almost automatic obeisance to a new and terrible earth goddess called Gaia.
You might think those questions were addressed at the real climate fanatics, those who�re absolutely determined to save the Earth even if that means over the megadeath, rigour-mortised and stacked-high burning corpses of humanity, but you�d be wrong because as must be obvious by now, those zealots simply don�t care about such collateral damage. After all, a smaller, more �sustainable� number of people on the Earth is one of their oft expressed aspirations. Humanity is a plague on the Earth, to quote David Attenborough.
Those questions were originally directed at the religious bodies of our rich developed world but with the sure and certain expectation of nothing in reply, not only because they were rhetorical but because the churches are by now in denial or wilfully blind to the moral issues presented by those questions.
They�ve fallen so far down into the abyss of the governing elite�s unquestioned dogma, which puts the Earth before the human cost of protecting it, that they now effectively worship a graven but green image in their desert of moral desolation. They�ve lost touch with that most basic imperative of all religions � the duty of care we all have towards the poor and vulnerable. Common decency, if you will.
Those questions, like this article, are now being addressed to the footsoldier clergy of those churches; the priests and the pastors, the imams and the rabbis, the holy men, the human beings representing their respective faiths and trying to make a difference in the lives of their local congregations.
This issue is not about science, since climate science has long ago allowed itself to become a compliant and willing harlot to politics. Like the great whore of Babylon, it sucks greedily on the teat of notoriety and all integrity has long since fled. Political sentiment can be changed because it�s driven by the fickle beast of popular opinion, which you still have a measure of influence over. What can�t be changed is that this is at heart a basic moral issue and morality is an invariant which should never be subject to the passing vicissitudes of fashion or alarmed public opinion.
The killing of the innocents is wrong, standing idly by when that�s done for nothing better than a mistaken idea grown into a well-intentioned but homicidal monster or for a quick buck, is wrong. Don�t delude yourself, the moneylenders are busy at work in your temples, doing brisk business under the righteous cloak of that false goddess Gaia but in reality serving nothing other than their own god Mammon. Your silence is helping them.
I�ll pose some new questions just for you, but I�m going to help you out by giving you the answers to them.
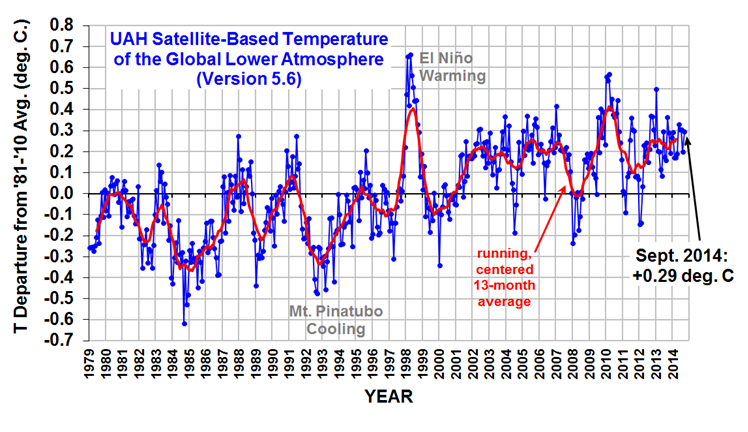
Will you ever read this article? Probably not. Will you ever read past the first page of Google�s reassuring results from various well-heeled green NGOs about any of the above questions? No. Will you ever stop to wonder how we eradicated malaria in the developed world using DDT and still have plenty of birds and bees? No. Will you ever try to calculate how many lives have been saved by us being malaria-free for over half a century? No. Will you think about why we�ve spent 800 billion dollars to fight global warming when the Earth�s temperature hasn�t risen in nearly two decades? No. Will you consider the effect that amount of money could have had on poverty relief around the world? No.
Will you at least admit that standing idly by and not speaking out means there�s some blood on your hands? Just a touch, a smidgen even? No.
You are this very day in the midst of a silent ongoing genocide, a slowmo invisible annihilation, a new shoah of such dimensions as to put the Nazis to shame and yet you will not acknowledge it or speak out about it. You do nothing. Nothing, nada, nada and nada every time. It�s Hemingway�s prayer and that�s the prayer of those who not only believe they�ve been abandoned by God, but have ceased to believe there can even be such an entity.
�Our nada who art in nada, nada be thy name thy kingdom nada thy will be nada in nada as it is in nada. Give us this nada our daily nada and nada us our nada as we nada our nadas and nada us not into nada but deliver us from nada; pues nada. Hail nothing full of nothing, nothing is with thee.�
Can there actually be a god? What sort of god could countenance such needless cruelty, suffering and callous waste of innocent lives? Deus irae? An angry god? Is there a reason? Do you have a reason? An excuse? Anything?
All those millions of preventable deaths are the direct result of political policies driven by nothing more than fashionable ideas about what our relationship with the Earth should be. In the midst of it all, you ignore the pressing issues, preferring instead to hotly debate schismatic irrelevances like female or gay priests. It�s no wonder that whole sections of churches in the developing word are considering decoupling themselves from what they consider to be out of touch mother churches in the developed nations, who simply won�t engage with real problems.
You plant saplings in your leafy suburbs doing your bit to save the Earth while the poor in the developing countries are running out of shrubs to burn to keep themselves alive. You talk about living in harmony with God�s good green Earth to your plump congregations while the world�s poor can do nothing more than lay damp towels over their dying children and hope for the fucking best. Tell me, who exactly needs your God�s forgiveness there? All my tears outside the walls of Babylon have long ago been wept; there�s nothing left in me now but an abiding anger towards you.
You are a part of the problem when you should by any decent notion of religious conviction be a major part of fixing it.
I am nothing and nobody, a small man with a small voice who long ago despaired of any faith in some sort of god. And yet I beseech you in the name of whatever god you follow to do something, or at least speak out. Like the Nazarene, you will not be rewarded for telling the simple truth.
Don�t tell me why god allows such things because there can be no reason, don�t bother debating god�s existence with me or his mysterious ways, just tell me why as a human being and a supposed man of god with some influence, you aren�t standing in your pulpit at every opportunity, raging and thundering to your congregation against such an obscene and preventable waste of human life and worse still, allowing that inhumanity to grind on day after pitiless day without doing a single thing about it.
Tell me why.
�Pointman

 Home/Blog