Global warming is the predicted result of increasing atmospheric CO2 causing a very small (~1-2%) decrease in the rate at which the Earth cools to outer space though infrared radiation. And the since temperature change of anything is always the result of net gains and losses of energy, a decrease in energy lost leads to warming.
The direct effect of that warming is only about 1 deg. C in the next 100 years, though (theoretically calculated, in response to an eventual doubling of CO2 late in this century). Climate models instead project 2 to 3 times as much warming as that, due to “positive feedbacks” in the climate system.
But the Earth hasn’t warmed as much as expected by the global warming pundits and their positive feedbacks, especially in the tropics where deep moist convection dominates the atmosphere’s response to forcing.
Why?
We know that water vapor is the main atmospheric gas which reduces the Earth’s ability to radiatively cool in the infrared (IR). And, unlike CO2, water vapor varies tremendously due to a variety of processes.
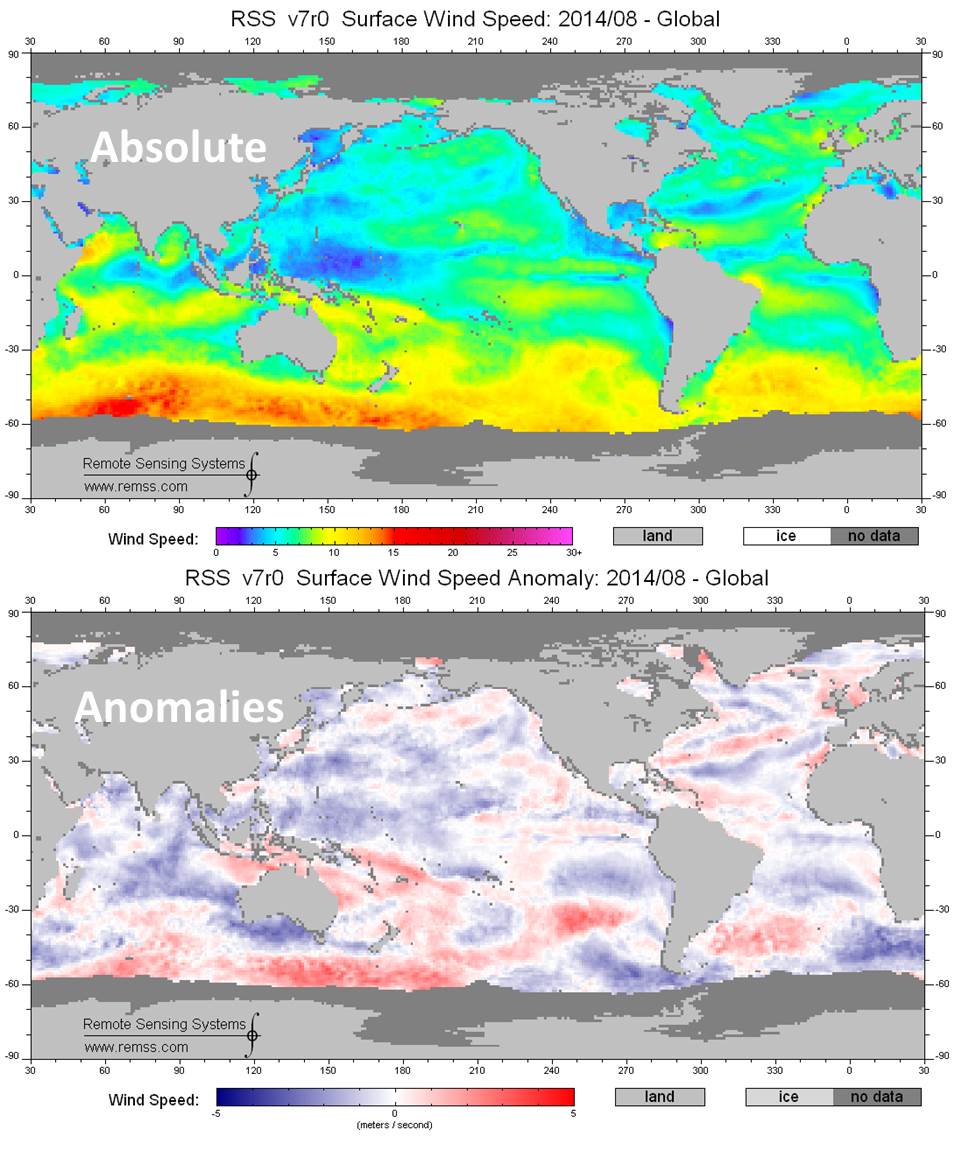
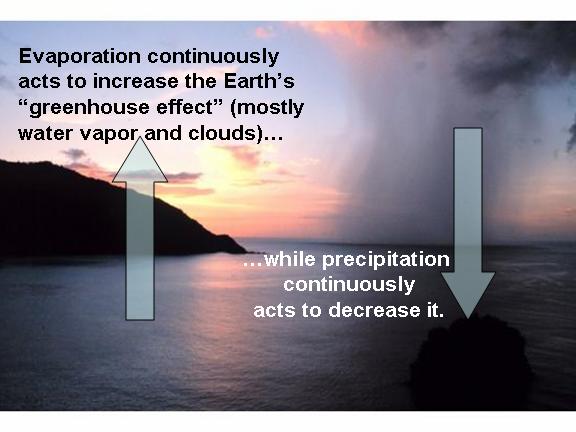
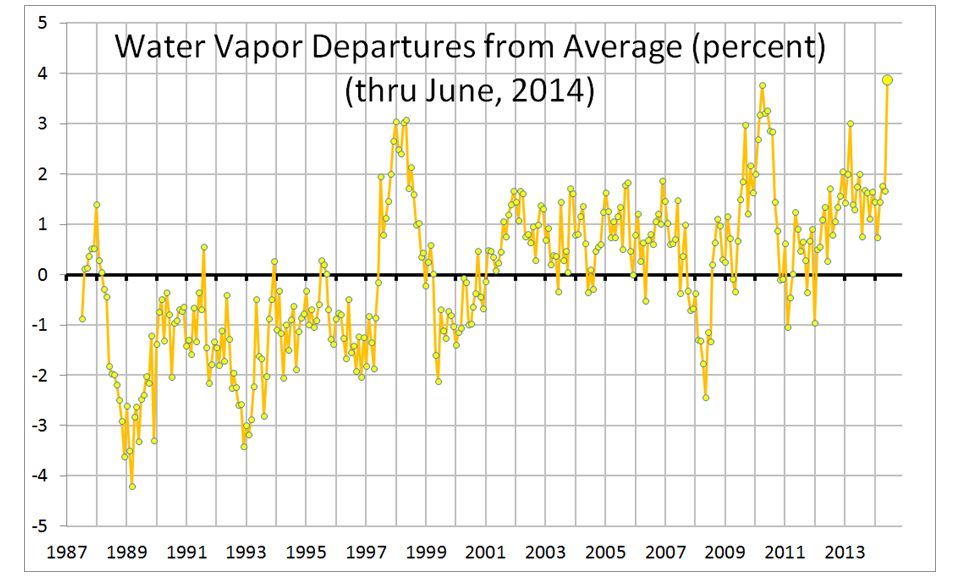
Increasing surface temperatures cause more evaporation which by itself increases the water vapor content of the atmosphere. Water vapor at low altitudes has indeed increased with warming, as I have shown here (over the oceans):
So, the simple-minded assumption has been that warming caused by increasing CO2 would cause more water vapor, which will enhance the radiative warming. That’s called positive water vapor feedback, which roughly doubles the amount of warming from the CO2 increase alone in climate models.
[Yes, I know that more water vapor evaporated from the surface cools the surface…that’s taken into account by the climate models, too.]
But for many years I have advocated the view that water vapor feedback on the long time scales of climate change might not be positive. Clearly, something is causing the current �pause� in global warming. The three most likely causes of the pause (in my view, not prioritized) are: (1) increasing cloud reflection reducing the solar input, or (2) decreasing water vapor (and maybe cirrus clouds) in the upper troposphere increasing the infrared output, or (3) an increase in ocean mixing sequestering extra heat in the deep ocean. Or, some combination of the three. (I’m not a big fan of other theories, like more aerosol reflection of sunlight from dirty Chinese coal, or problems with the CO2 theory itself. Not that they are necessarily wrong.)
Our 1997 BAMS paper (Spencer & Braswell, 1997) discussed the importance of middle and upper tropospheric vapor to the IR cooling rate of the Earth. I also blogged about water vapor feedback four years ago. Basically, the bottom line is that it’s the processes controlling upper tropospheric water vapor which have the biggest impact on the IR cooling rate of the Earth.
As Spencer & Braswell (1997) showed, at low relative humidities often seen in the upper troposphere (below, say, 30%) a tiny change in water vapor content has a huge effect of the infrared cooling rate of the Earth. So you can have large increases in lower tropospheric vapor, but a small decrease in upper tropospheric vapor can completely negate the resulting water vapor feedback.
A recent paper which claims to have new satellite evidence of positive water vapor feedback uses highly uncertain infrared water vapor channel data (6.7 microns) which has unknown long-term instrument stability, and unknown diurnal drift effects (issues which we have spent 20 years on with the microwave temperature sounders), and unknown cloud contamination effects.
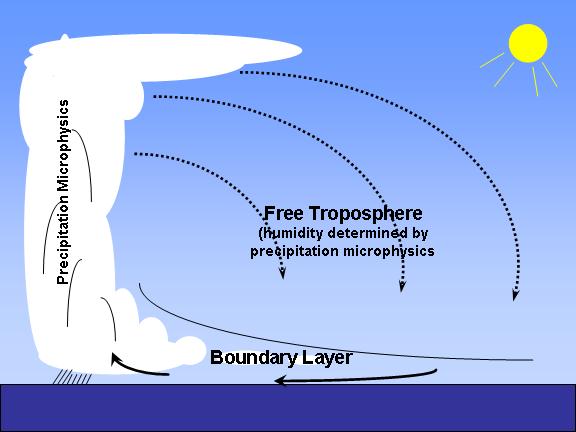
The important thing to understand is this: the largest control of water vapor feedback is the efficiency of precipitation systems, which controls how much water vapor is detrained into the upper troposphere. This process is what controls the humidity of the atmosphere on a clear day…that clear air is being forced to sink by rising air in precipitation systems, and its humidity (and thus its influence on the IR cooling rate of the clear air to space) can also be traced back to microphysical processes in precipitation systems. Clear air might seem boring, but it has a huge influence on the Earth’s temperature, through its humidity controlling the rate at which the Earth cools to space.
While climate models can be tuned to produce the average amount of water vapor in the upper troposphere reasonably realistically, we do not understand how precipitation efficiency changes with warming, and so the physics cannot currently be included in climate models for the purpose of predicting climate change.
On the subject of this uncertainty, a 20-year old paper by Renno, Emanuel, and Stone (1994) concluded:
“The cumulus convection schemes currently in use in GCMs (general circulation models) bypass the microphysical processes by making arbitrary moistening assumptions. We suggest that they are inadequate for climate change studies.“
That paper described from a theoretical point of view how high precipitation efficiency causes a cool and dry climate, while low precipitation efficiency causes a warm and moist climate.
While I’m sure that convective parameterizations are better today than they were 20 years ago, they really can’t address something this complex. Even much more sophisticated cloud resolving models (CRMs) still make rather arbitrary assumptions regarding the conversion of cloud to precipitation. And that which isn’t converted to precipitation re-evaporates and then changes the humidity of clear air.
It might well be that the limited radiosonde evidence we have of lower tropospheric moistening and upper tropospheric drying (e.g. Paltridge et al., 2009) is telling us that water vapor feedback is not positive, as is currently assumed in climate models. This is basically the reason why Miskolczi (2010) found a constant greenhouse effect…that the observed decrease in upper tropospheric humidity (which is controversial from an observational standpoint) just offset the warming caused by increasing CO2.
None of the above regarding water vapor feedback is new, and even our 1997 paper examined issues Dick Lindzen was advocating at least a decade before us. I’m presenting it again to remind ourselves of how little we really know about climate change.
And don’t even get me started on cloud feedback.

 Home/Blog
 While as many as 100,000 people gather in New York City tomorrow to march for the use of more unreliable and expensive energy, over 300,000,000 people will be staying home.