Home/Blog
(This post is being superceded, as John Christy has pointed out I used the unadjusted USHCN data for this.)
As many of you are aware, Heartland’s 9th International Conference on Climate Change (aka the “skeptics conference”) will be held in Las Vegas, Nevada during July 7-9, 2014.
Anthony Watts has already posted some July temperature statistics for Las Vegas…basically, it’s really hot there in July.
What is notable about the “official” surface temperature record there is the strong urban heat island (UHI) effect which still remains in the USHCN data. Daytime warming has been modest, but nighttime warming has been spectacular….10 deg. F or more since the 1940s.
How does something like this spurious warming still remain in the USHCN data? The “homogenization” adjustment procedure that NOAA uses in USHCN apparently does not effectively remove the spurious warming. Anthony has posted extensive evidence regarding this issue in the past.
I examined the raw 3-hourly temperatures (from NOAA Integrated Surface Hourly [ISH] data) collected at McCarran Airport in Las Vegas, as well as at Nellis Air Force Base, since 1973. It clearly shows how nighttime temperatures have increased in the last 40 years compared to the daytime temperatures:
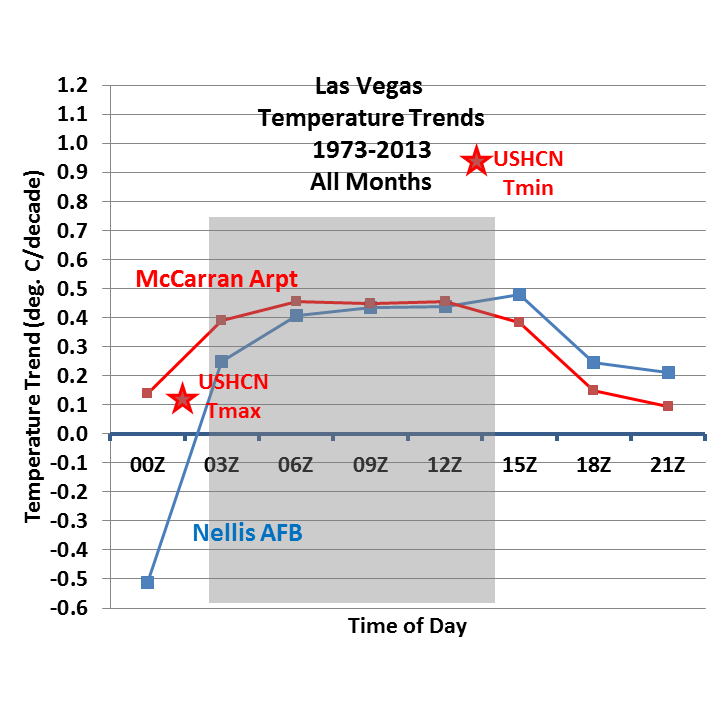
Las Vegas temperature trends 1973-2013 as a function of time of day (dark shading is approx. nighttime hours).
What is rather remarkable, though, is that the USHCN temperature trends for the same period (1973-2013, the red stars), while agreeing with the ISH 3-hourly data for Tmax, are twice as warm as the ISH data for Tmin.
How can this be?? How can the USHCN adjustment procedures actually magnify the nighttime warming, rather than reduce it? I have no explanation for this. (Nellis AFB data are not available in the USHCN data after 1970 for some reason).
If we just focus on the month of July, the results are roughly similar to the full-year results:
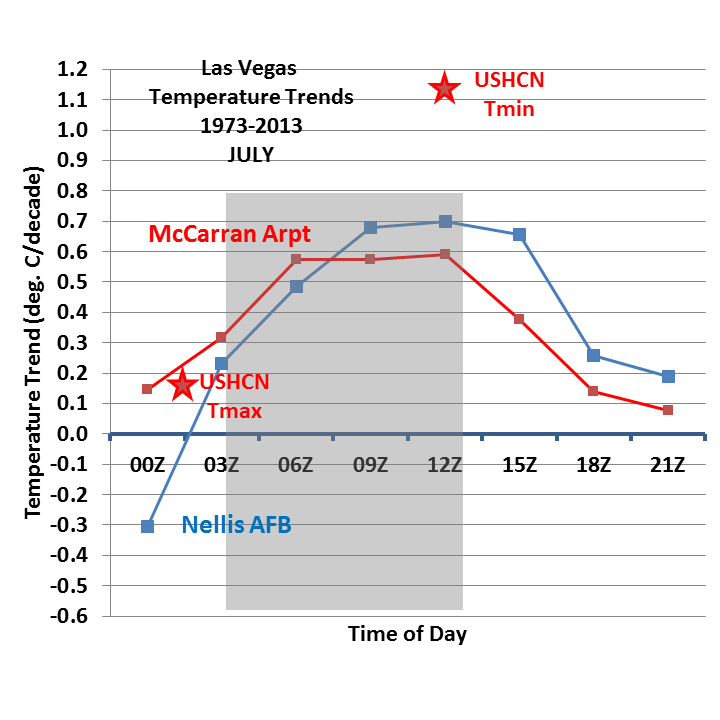
Fig. 2. As in Fig. 1, but for the month of July.
Las Vegas has seen dramatic growth over the time period represented above. The number of visitors has skyrocketed from 8 million in 1973 to about 40 million today, a factor of 5 increase. The population has increased by a factor of about 6 or 7.
All of this translates into more waste heat from air conditioning, plus more artificial surfaces which warm faster than natural surfaces. If you doubt this for even the natural desert surrounding Las Vegas, look at the Landsat IR thermal imager data in this report.
During the day, the extra heat can mix convectively through a pretty deep layer of the atmosphere, which limits the daytime warming. But at night, the nocturnal inversion traps heat, magnifying the UHI effect.
The bottom line is that the USHCN data still seems to contain significant UHI effects, which are inflating warming trends, possibly even in the daytime. So, at this point, I don’t think we know if there has been any “global warming” experienced in Las Vegas.
And when it comes to the UHI effect, I doubt that the old adage “what happens in Vegas stays in Vegas” applies.