 Home/Blog
You have to laugh at least once a day. Because a day without sunshine is like…night.


You have to laugh at least once a day. Because a day without sunshine is like…night.
Why is it that a bible-believing scientist’s views on science are automatically discounted by some people?
I usually try to avoid the “R” issue, except that Ethan Epstein of the Weekly Standard chose to take a swipe at me in his otherwise good article on our dean of climate skeptics, Dick Lindzen.
Normally, I just ignore this stuff, but my e-mail has been blowing up in the last couple of days. So, against my better judgment, here are some thoughts on the subject…more for the benefit of those who are more outraged than I am (I expect to be attacked).
First, the hypocrisy. When warmist scientists like Sir John Houghton use the Bible to support action to fight global warming (e.g. his book Global Warming: The Complete Briefing) that was OK with everyone. Same with Katherine Hayhoe and Thomas Ackerman.
So, I guess it depends upon whether the bible-believer agrees with them before the warmists decide to trash Bible-believing ways.
In the case of global warming skeptics, I suppose the accusation is part of the assumption that bible-believers feel that “God is in control”, and so everything will turn out OK no matter what we do. Go ahead and pump all the CO2 into the atmosphere you want. The Big Guy will take care of it.
Except that I don’t put myself in this class. I readily admit that we have more than enough nuclear weapons to virtually wipe out humanity. I admit that evidence of human pollution can be found in almost every corner of the world.
In other words, we know that humans are capable of creating a huge amount of misery for ourselves, which we have done repeatedly down through history. Catastrophic global warming could, at least theoretically, be just one more example of this.
Except that I view CO2 as one of those cases where nature, on a whole, benefits from more of our “pollution”. The scientific evidence is increasingly supporting this position.
This is not a big stretch considering that CO2 is necessary for life to exist on Earth, and yet only 4 molecules out of every 10,000 in the atmosphere are CO2. Venus and Mars have atmospheres that are almost 100% CO2; life on Earth, in contrast, has sucked most of it out of the atmosphere. No matter how much we produce, nature automatically takes out 50% and uses it.
Epstein incorrectly assumes that I support the wording of all of the positions of the Cornwall Alliance, as stated in their Cornwall Declaration. But the Director of the Cornwall Alliance knows I don’t. We’ve discussed it.
Nevertheless, I still support the work of Cornwall. Seldom does a member of an organization agree with all of that organization’s stated positions.
Why do I support it? The central reason is I believe that current green energy policies are killing poor people.
Anything that reduces prosperity kills the poor. This is the single biggest reason I speak out on global warming, and why the Cornwall Alliance speaks out against policies which end up hurting the poor much more than they help.
Radical environmentalism is interested in seeing more people dead than alive. I don’t care what their press releases say. I’ve debated enough of these folks to know that their biggest complaint is that there are too many people in the world.
Some have claimed that the Earth would be just lovely without any humans. (Extra points for anyone who can spot the oxymoron there).
On a more superficial level, the accusation is often that the Bible-believing scientist “rejects settled science”, in my case the naturalistic “explanation” for the origin of life. How can anyone trust a climate scientist who rejects “settled science”?
Except this claim reveals an appalling lack of knowledge on the part of the accuser. In general, nothing in science is ever settled. And in particular, no one knows how life arose from non-living matter. It remains a mystery today.
Belief in the naturalistic origin of life is just as religious as the belief in a creator. Even well-known evolutionists have admitted this.
The scientific evidence for a “creator” is, in my opinion, stronger than the evidence that everything around us is just one gigantic cosmic accident. I have no trouble stating that — and defending it — based upon science alone. No need to quote the Bible.
But why should any of this matter for real, observable science, like climate change? Belief in macroevolution is a religion, not science. It is an organizing system of thought, a conceptual model of origins, a worldview, which the evolutionist must fit all of his observations into.
The only explanation I can think of for the Weekly Standard swipe at me is that Mr. Epstein is one of the great sea of journalists who has a considerable breadth of knowledge of many subjects, but only limited depth.
Epstein is probably not aware that science is based upon a set of assumptions — unprovable assumptions. That nature is real. That humans are capable of knowing its true nature. That nature is unified.
The existence of the universe itself violates either the 1st or 2nd Laws of Thermodynamics. That’s why cosmologists must invent physics no one has ever observed to explain how everything came to be.
Is that “science”? Really?
Epstein doesn’t understand that even atheist scientists are also guided by their religious belief that there is no creator. All scientists interpret data based upon their preconceived notions.
In Earth science, I find most researchers believe nature is fragile. But that is not a scientific position, it is a religious one. No less religious than my view that nature is resilient.
In short, there is no such thing as an unbiased scientist.
Furthermore, apart from religious considerations, not all scientific problems are created equal. Surely even journalists are capable of understanding that.
For example, the force of gravity is relatively simple, and we can predict the position of the planets far in advance with great accuracy because gravitation is just about the only force that needs to be considered in those calculations.
But the complexity of the climate system, and especially how it varies, is orders of magnitude more difficult to understand. It currently exceeds our ability to usefully predict its future state. Who can look at the epic failure of the climate models to explain past (let alone future) tropical temperatures over the last 30+ years, and still think that scientists can foretell climate?
And if scientists ever are able to “create life” in a test tube from non living chemicals, through all of their hard work and creativity, exactly what will that have proved?
That life could have arisen by chance? Really? Think about it.
Furthermore, life has to do more than just come into being. It has to reproduce. How does that happen by chance? Researchers have computed the probability of it happening to be essentially zero.
I’m afraid my faith isn’t strong enough to believe in such silliness.
And if you are going to comment, “Exactly what research shows all of this, Dr. Spencer?” Well, to paraphrase (and with apologies to) William F. Buckley, Jr., “Do your own damn Google search.”
NO.
This is the first paper in a long time that made my brain hurt to read.
“Spread in Model Climate Sensitivity Traced to Atmospheric Convective Mixing“, by Sherwood, Bony, and Dufresne is actually quite well written (Nature editors help to make sure scientists don’t publish bad prose in their magazine). But the concepts involved are pretty complicated, which is what happens when you try to understand atmospheric convection.
Basically, the authors claim to show that a significant amount of the spread in the climate sensitivity across dozens of climate models is due to how the models partition tropical convection between deep versus shallow convective mixing.
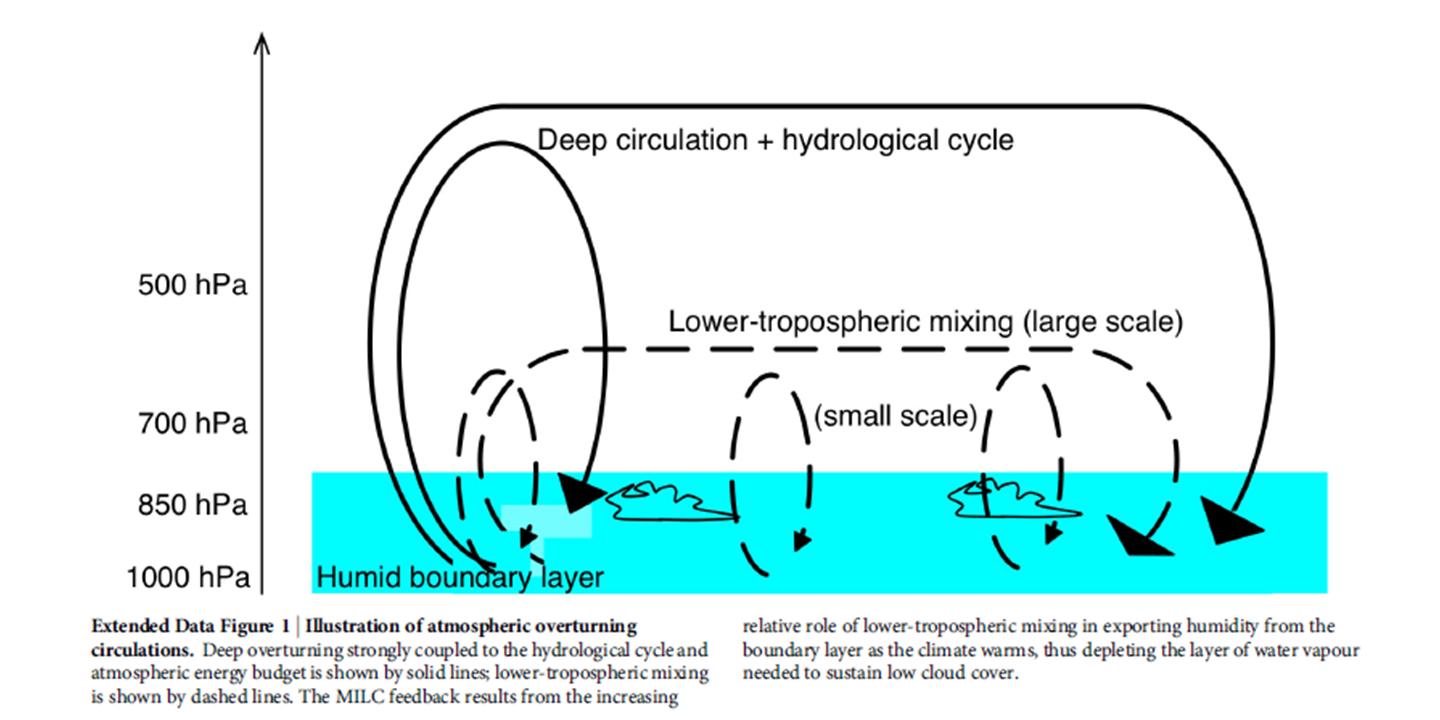
Although I don’t yet fully understand their reasoning, they claim these differences impact low cloud amounts, and thus low cloud feedback in the models. Low cloud feedback is arguably the least certain feedback in models, capable of either greatly amplifying or reducing the small direct warming from more CO2 in the atmosphere.
The authors present evidence that those models which have the strongest shallow mixing are the closest to the observations. Furthermore, since those models also exhibit the strongest positive low cloud feedback, we should believe the predictions of the models that predict the most warming for the future.
(What’s that you say? You thought the models with the most warming were also the ones which have failed most miserably in their temperature predictions over the last 30+ years? Ha! You silly mortal! The Climate Modelers now have a new, complex diagnostic quantity to test models with…not that silly old temperature metric.)
The paper does seem to provide some new and important insight into why different climate models have different strengths of low cloud feedback. But I suspect their “observational evidence” of just how strong shallow mixing in the real tropical atmosphere is (the MERRA reanalysis model) is, in this case, more model than it is observation. We don’t really have direct observations of the average strength of tropical lower tropospheric mixing. And even if it is true that the most sensitive models have the most realistic lower tropospheric mixing, there are so many different compensating (and highly parameterized!) processes in models, I don’t think we can use such model diagnostics as reliable tests for climate sensitivity. At least not yet.
So, for the time being, I’m sticking with the simpler tests…such as simple energy conservation and just how much the ocean/atmosphere system has warmed in the last 50 years.
The paper thus represents a bold prediction in the face of contrary evidence. So I give Sherwood et al. 5 stars out of 5 in the much-coveted cojones category.
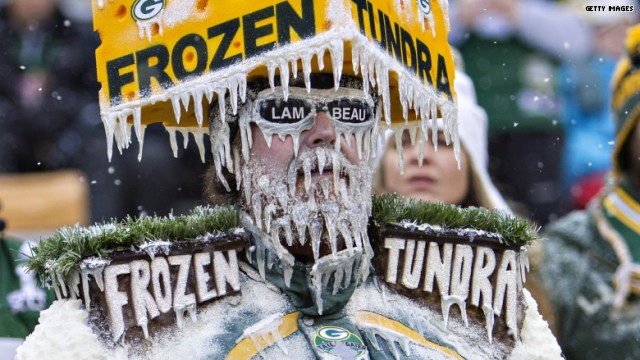
The short answer is: colder than I would want to sit out in. I’m originally from the UP of Michigan, but over 30 years living in the South has softened me up.
But it’s probably not going to be as cold as it was looking several days ago. I’ll explain “probably” in a moment.
In this weather situation, it’s all in the timing of the cold air arrival. The air mass is indeed cold enough to set a NFL record for coldest game…if the game was held 24 hours later.
But the cold air is moving in a little more slowly than expected. At this point (1 p.m. CST) I’m expecting it will still go below zero during the game…the record is -13 deg F or so, during the Dec 31, 1967 Ice Bowl. That record probably won’t be broken.
But what’s kind of interesting is that the noon temperatures just northwest of Green Bay, which is the direction the cold air is moving in from, are running considerably colder than predicted just several hours ago:
Antigo was -6 deg at noon, which is 4 deg colder than it was supposed to be.
Wausau was -7 deg F at noon, which is fully 7 deg. colder than it was supposed to be (0 deg. F).
(Here’s our WeatherStreet.com interactive surface weather map for Wisconsin.)
So, there appears to be a secondary cold front moving through. I suspect the temperature late in the game will drop rather quickly…not pleasant. It will only need to reach +1 F to put it in the top 10 coldest NFL games. I think it will beat that, anyway.
Global warming alarmists hate it when things don’t go their way.
MSNBC seems to have more than its share of angry “journalists” lately. Chris Hayes of MSNBC on Thursday complained of the “strange bizarre underworld of climate trolls” who come out whenever the weather is unusually cold.
He was particularly targeting Matt Drudge, who frequently highlights dichotomies, if not outright hypocrisy, in the press coverage of issues…such as global warming and the recent fiasco in Antarctica where a ship of “researchers” going down there to highlight disappearing ice got stuck in a record amount of that disappearing ice. Virtually none of the news outlets covering the story mentioned the (ironic) reason why they were down there in the first place.
Oh, you “snow trolls” know who you are. You are the people who think it’s somehow fair to point to cold waves as evidence against global warming, when in fact we should only be pointing to heat waves in support of global warming. Didn’t you guys get the memo?
Well, apparently the rest of the world didn’t get the memo, either. Here’s the last 10 years of weekly Google Trends search interest for the keywords “weather” and “climate”:
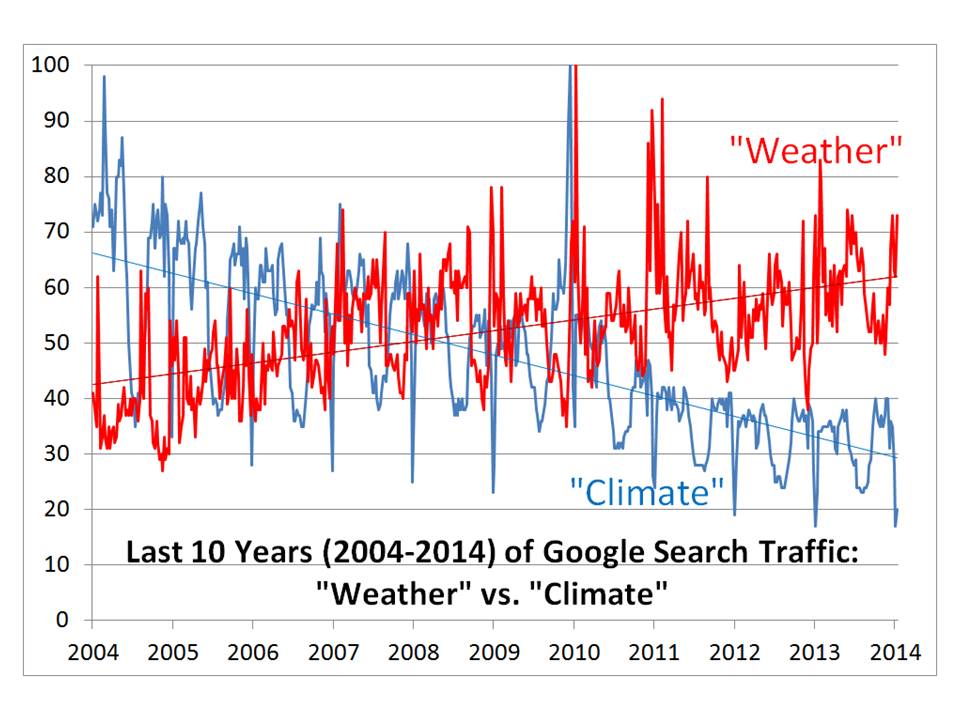
Clearly, interest in weather has been going up; interest in climate has been going down. I wonder why?
If heat waves and droughts really were getting worse, wouldn’t internet search traffic on climate issues be going up? Hmmm? Or was the climate change issue oversold, and now climate fatigue has set in?
Inquiring minds want to know.
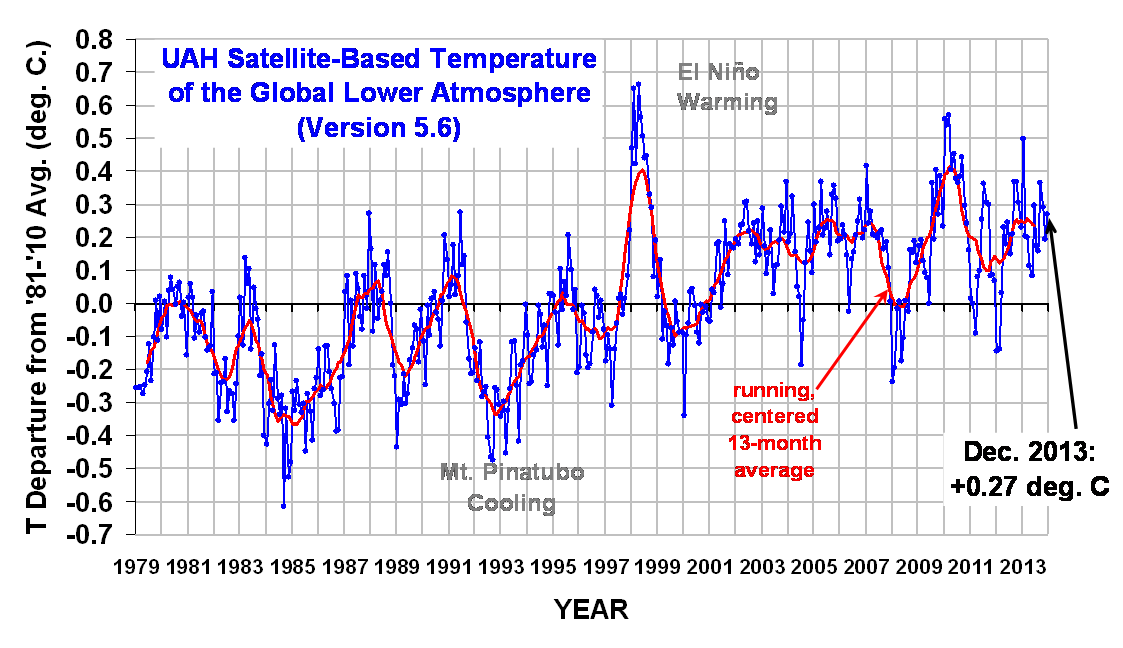
The Version 5.6 global average lower tropospheric temperature (LT) anomaly for December, 2013 is +0.27 deg. C, up from +0.19 deg. C in November (click for full size version):
The global, hemispheric, and tropical LT anomalies from the 30-year (1981-2010) average for the last 12 months are:
YR MON GLOBAL NH SH TROPICS
2013 01 +0.496 +0.512 +0.481 +0.387
2013 02 +0.203 +0.372 +0.033 +0.195
2013 03 +0.200 +0.333 +0.067 +0.243
2013 04 +0.114 +0.128 +0.101 +0.165
2013 05 +0.082 +0.180 -0.015 +0.112
2013 06 +0.295 +0.335 +0.255 +0.220
2013 07 +0.173 +0.134 +0.211 +0.074
2013 08 +0.158 +0.111 +0.206 +0.009
2013 09 +0.365 +0.339 +0.390 +0.189
2013 10 +0.290 +0.331 +0.250 +0.031
2013 11 +0.193 +0.160 +0.226 +0.020
2013 12 +0.265 +0.273 +0.257 +0.057
Here’s the global lower tropospheric temperature anomaly map for 2013:
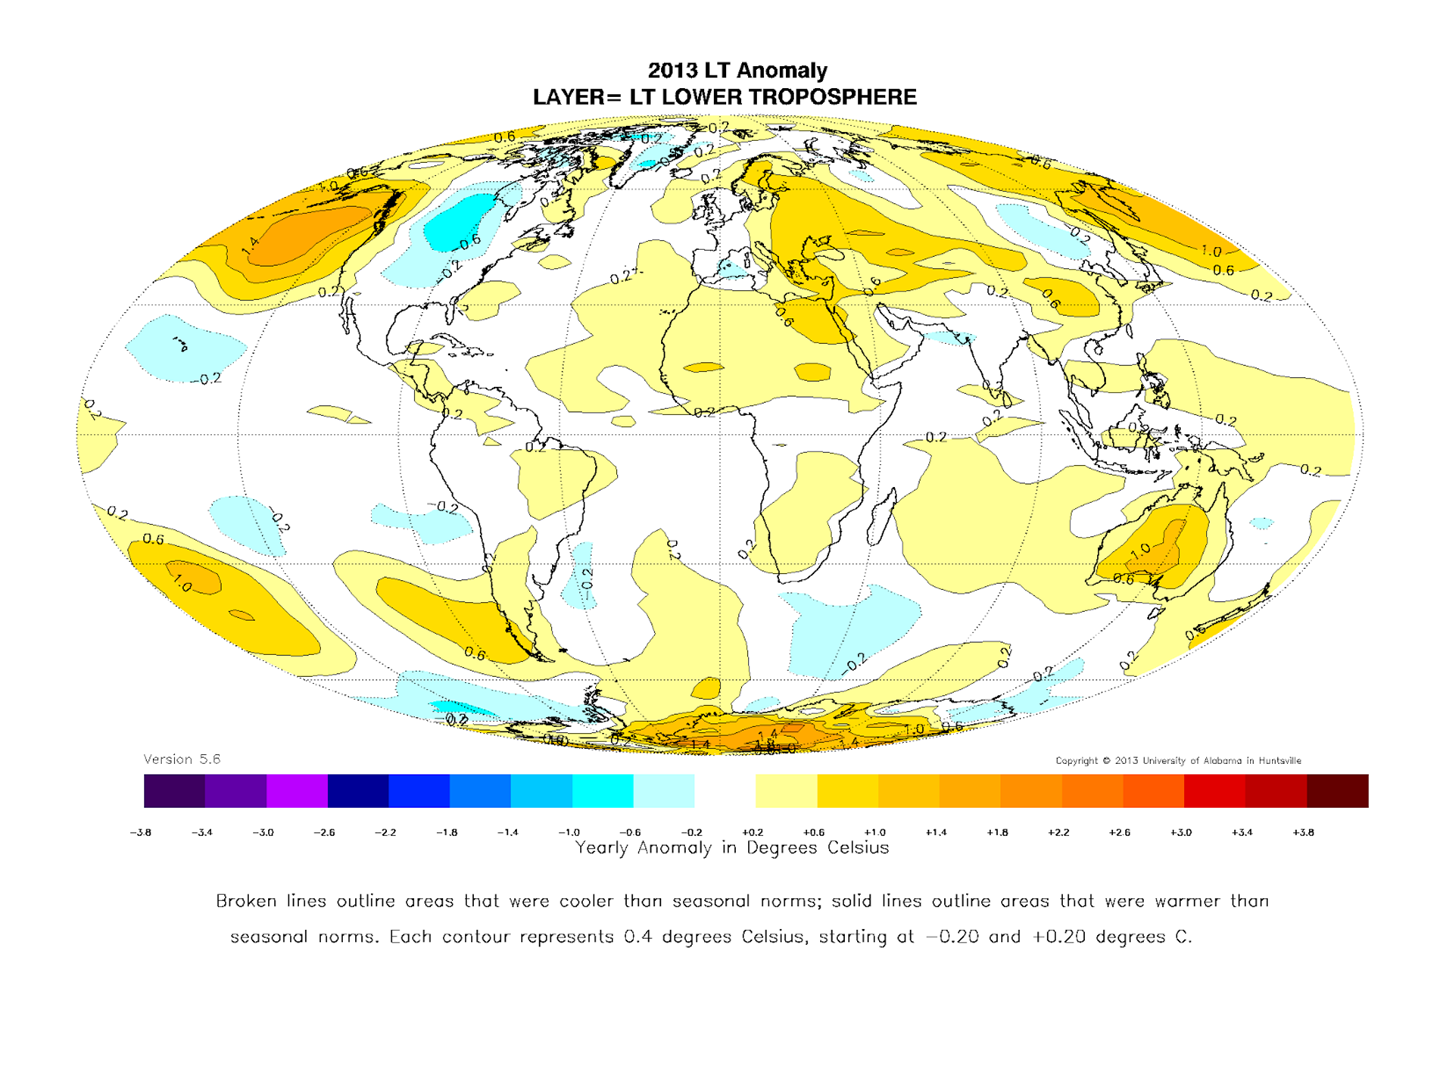
Other global images are archived here.
The global average anomalies by year (2013 was the 4th warmest since satellite monitoring started in 1979):
1979 -0.170
1980 -0.008
1981 -0.045
1982 -0.250
1983 -0.061
1984 -0.353
1985 -0.309
1986 -0.244
1987 +0.013
1988 +0.012
1989 -0.207
1990 -0.022
1991 +0.020
1992 -0.289
1993 -0.245
1994 -0.108
1995 +0.013
1996 -0.076
1997 -0.049
1998 +0.419
1999 -0.056
2000 -0.061
2001 +0.107
2002 +0.218
2003 +0.187
2004 +0.108
2005 +0.260
2006 +0.186
2007 +0.204
2008 -0.009
2009 +0.209
2010 +0.398
2011 +0.130
2012 +0.170
2013 +0.236
Popular monthly data files (these might take a few extra days to update):
uahncdc_lt_5.6.txt (Lower Troposphere)
uahncdc_mt_5.6.txt (Mid-Troposphere)
uahncdc_ls_5.6.txt (Lower Stratosphere)
UPDATE: It is now looking like the coldest air is moving into Green Bay 6-12 hours later than expected, with the latest forecast for a 6 p.m. temperature being +1 deg. F, which would not break a record.
The latest GFSx MOS temperature forecast is now -8 deg. F -10 deg. F -8 deg. F -4 deg. F +1 deg. F for game time in Green Bay on Sunday evening for the playoff game between the Packers and the 49ers. This is getting awfully close to the record coldest NFL game temperature of -13 deg. F, set Dec. 31, 1967 at Lambeau Field during “The Ice Bowl”, the NFL Championship game between the Packers and Dallas Cowboys.
The 2nd coldest game was Jan. 10, 1982 at Riverfront Stadium during the AFC Championship game between Cincinnati Bengals and San Diego Chargers, at -9 deg. F, so Sundays game might take the #2 spot instead.
The deciding factor will be the timing of how fast the coldest air moves in on Sunday. The air mass is plenty cold enough to break the record, with a Monday high temperature forecast of -14 deg. F.
The top 10 coldest NFL games are listed here. Makes my hands hurt just thinking about it.
WARNING: This is not a climate or weather post. It is my quasi-annual rant on basic economics.

A conversation overheard many years ago�
Business Owner: Hey! Wanna buy this cool gadget? It allows you to make phone calls from just about anywhere. We call it a �self phone�.
Consumer: Hmm. Why would I want that? I can make calls from my office, or my home, or a gas station if I�m out and about.
Business Owner: Well, wouldn�t you like to be able to call from your car? Or not miss a call just because you are driving? What if your car breaks down and you are stuck on the highway? Or, you are at the grocery store and you forgot what your wife asked you to pick up? And what if I told you that long-distance calls on these things will eventually be free? AND�you will be able to send pictures you take with it to friends, instantly!
Consumer: Say, that does sound pretty good! What�s the catch?
Business Owner: No catch. It won�t cost much more than that Pong video game you just bought, and is way more useful. But�if the billions of dollars we are investing in this new technology pays off, some of us who have devoted our careers to developing it might get rich, since a few percent of the cost will be paid to us.
Consumer: Well, that�s ok with me! I�ll take a self phone!
Business Owner: Are you sure?
Consumer: SELF PHONE! SELF PHONE!
One of the great epiphanies of my life was finally understanding basic economics. It holds a fascination for me because so many people believe just the opposite of what is, in fact, true.
As I discuss in my book Fundanomics: The Free Market Simplified, prosperity is achieved though people having the freedom to provide as many goods and services to each other as are wanted and needed�and being rewarded for it when they succeed.
It’s really no more complicated than that.
After 30 years of studying and thinking about the continuing desire by about half of the population to achieve things like “income equality”, “wealth redistribution”, a “living wage”, etc., I’ve become convinced that the faulty thinking underlying these seemingly noble goals stems, more than anything else, from one basic misconception: that the stuff we all want and need will always get produced anyway.
If there was always the same amount of stuff being produced, no matter what tax policies and regulations we had, then redistribution of wealth would actually make some sense to me. But the modern economy requires efficiency, which in turn requires rewarding good ideas, punishing bad ideas, and inherently risky investments of large amounts of money in order to achieve economies of scale.
Even today’s poor now own cars, TVs, microwave ovens, cell phones, etc. These things do not happen by accident, and I am old enough to remember when most of the products we now take for granted were luxuries. These products only become affordable to the masses when people with the good ideas and money to invest have some hope of being rewarded if they succeed.
After all, most ideas for new products fail, and investors routinely lose large sums of money they have invested in trying to bring the new product to market. We usually only see the small fraction of people who are the winners. They have the fancy cars and the big houses. They are the ones who some are now so eager to see punished for their success.
But we usually don’t notice the far greater number of losers, those who tried to succeed with some new product, but who failed. Who is willing to step up and share in (redistribute) those failures to the rest of society, the way they want to redistribute the wealth of those who succeeded?
The only way the newest and most affordable products ever have a hope of reaching consumers is if those who develop them and risk their investment have some hope of being rewarded if they succeed.
We should celebrate the rich, not demonize them. They take the risks. They have the great ideas. They bring prosperity to the masses.
Which brings me to another truth which is not mentioned often enough: The prosperity which the rich have created for all of society in the form of better products at lower prices far exceeds the relatively small profit they get to keep as a reward for their success.
If we threaten to take those profits away from them, the energizing force that generates prosperity for all — including the poor’s cars, TVs, microwave ovens, and cell phones — will stop.
Some have called business-friendly policies “trickle-down economics”, a term which I really dislike. First, it’s not a “trickle”. The vast majority of prosperity generated by the success of business owners is literally in the hands of millions of consumers, in the form of goods which the consumers now own. The business owners and corporate executives get to keep only a tiny fraction of that wealth.
Secondly, the consumers are usually the first — not the last — to see the rewards of great new products. Businesses usually have to make sure their employees are taken care of before they can turn a profit. Furthermore, we consumers routinely get great deals on products from businesses that fail because the business spent more on developing, manufacturing, and bringing the product to market than they got in return from the sales price.
These are really simple, basic concepts. At the heart of economic prosperity is freedom. Freedom to pursue happiness, if you will. Concepts which have been understood and successfully put into practice for centuries in many countries.
Unfortunately, our government has been moving in the wrong direction, increasing the tax and regulatory burdens on businesses, killing the lifeblood of our economy.
Pandering politicians use vague and misleading arguments to claim that the economy is suffering because the rich are not sharing their wealth, or some such thing. This resonates with the low information voter. But money has no value without people actually doing things for each other. This is what a successful business enables.
You could take away all of the wealth of the rich tomorrow and put a few thousand dollars in everyone’s pockets. But then what will you do next year, when those business owners decide they will no longer risk staying in business, and all move to Coast Rica or Belize?
The truth is that the government is gradually encroaching on the freedoms businesses have traditionally enjoyed, reducing their ability to hire people and bring new, better, or less expensive products to market so that prosperity might be increased for all of society.
The government continues to prop up the stock market, giving the illusion that investors are “bullish” on American business. But they are only bullish on the government’s temporary meddling in the economy, which must eventually end as we continue to print money (which has the same effect as raising taxes) and borrow from future generations.
Unless those with the means to grow businesses are given some hope of being rewarded for risking their investments, they will not invest. That hurts everyone, in all economic classes.
It’s not rocket science, people. The government doesn’t create prosperity…it doesn’t make cell phones or cars or even pizzas. And when it has tried, it does so inefficiently because government is not punished for its failures, the way free and open competition punishes bad ideas and inefficiencies.
The main role of government in the economy should be to make sure people play fair…and then get out of the way.
Gotta go�my self phone is ringing.
The weather forecast models continue to predict a major cold outbreak for next week over the eastern 2/3 of the U.S. Here’s the Tuesday morning (Jan. 7) forecast for 850 mb temperatures from the GFS model (that’s at ~5,000 ft altitude):
That is a seriously cold air mass. I predict many cold temperature records will be broken with this event. It looks like solid freezes extending into northern Florida.
But look on the bright side. Without global warming, it could have been 1-2 deg. F colder still!


Copyright 2026 Roy Spencer, Ph. D. - All Rights Reserved
