Home/Blog
In Part I of this series, I mentioned how Wood’s (1909) “greenhouse box” experiment, which he claimed suggested that a real greenhouse did not operate through “trapping” of infrared radiation, was probably not described well enough to conclude anything of substance. I provided Wood’s original published “Note”, which was only a few paragraphs, and in which he admitted that he covered the issue in only cursory detail.
Wood’s experiment was not described well enough to replicate. We have no idea how much sunlight was passed through his plate of rock salt-covered box versus the glass-covered box. We also don’t know exactly how he placed another glass window over the rock salt window, which if it was very close at all, invalidated the whole experiment.
I also mentioned two more recent experiments which came to totally opposite conclusions: one showed a substantial temperature rise in a glass covered box versus one covered with an IR-transparent material, the other did not.
Here I’ll present first results from my own backyard experiment. Ideally, one wants to have identical boxes in terms of their absorption of sunlight and resistance to conductive heat loss. We want to measure just the effects of IR-transparent and IR-opaque materials placed over the boxes on their energy budgets, as measured by a temperature difference of the air trapped within the boxes.
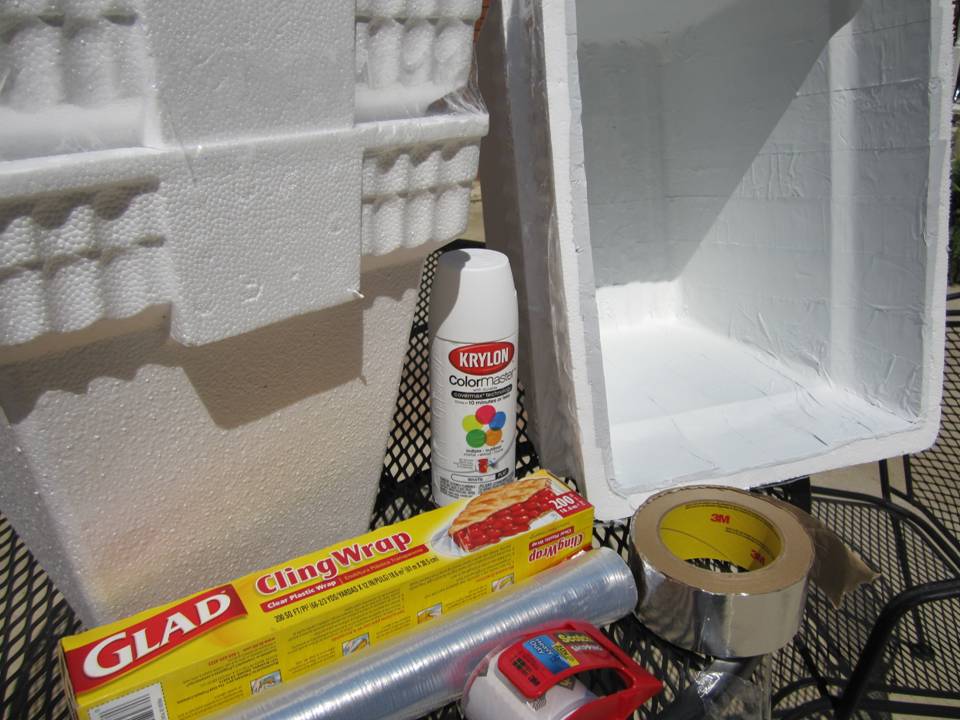
I used inexpensive Styrofoam coolers purchased from WalMart, doubled-up and sealed with transparent packing tape to trap the air space between them. The insides of the coolers were completely lined with adhesive metal tape from Lowes, then sprayed with 3 coats of Krylon #1502 flat white paint, which has a measured IR emissivity of at least 0.99:
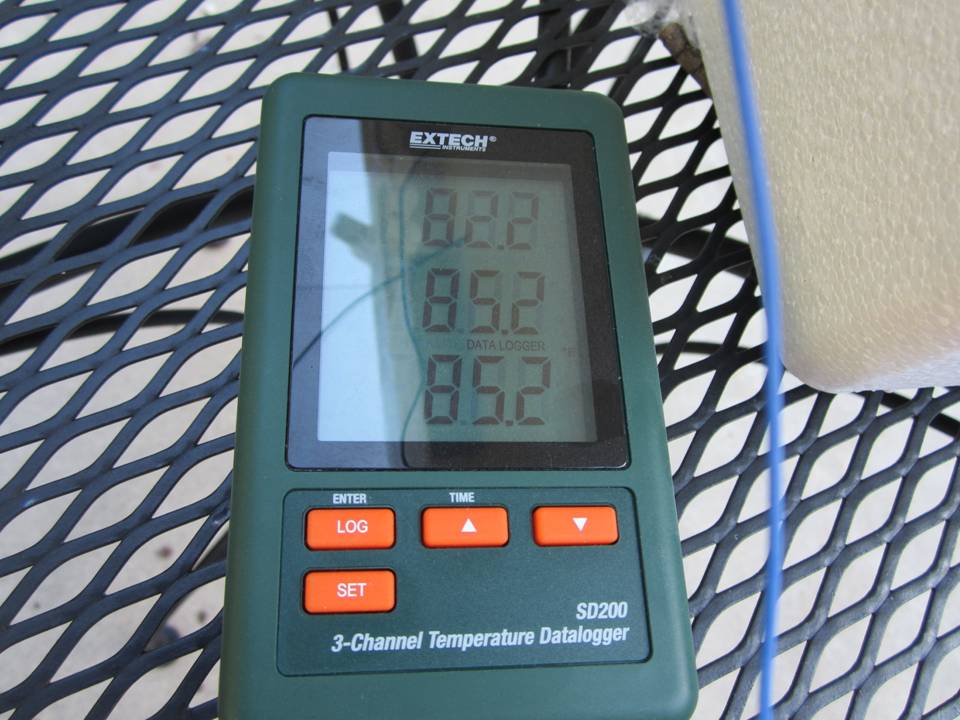
Temperatures within the boxes are monitored with K-type probes using a 3-probe Extech SD200 thermometer datalogger, set to record temperatures every 2 minutes, as well as the ambient air temperature in the shade of one of the boxes. The probe tips in the boxes were in the shade near one end, half way between the top and bottom of the coolers:
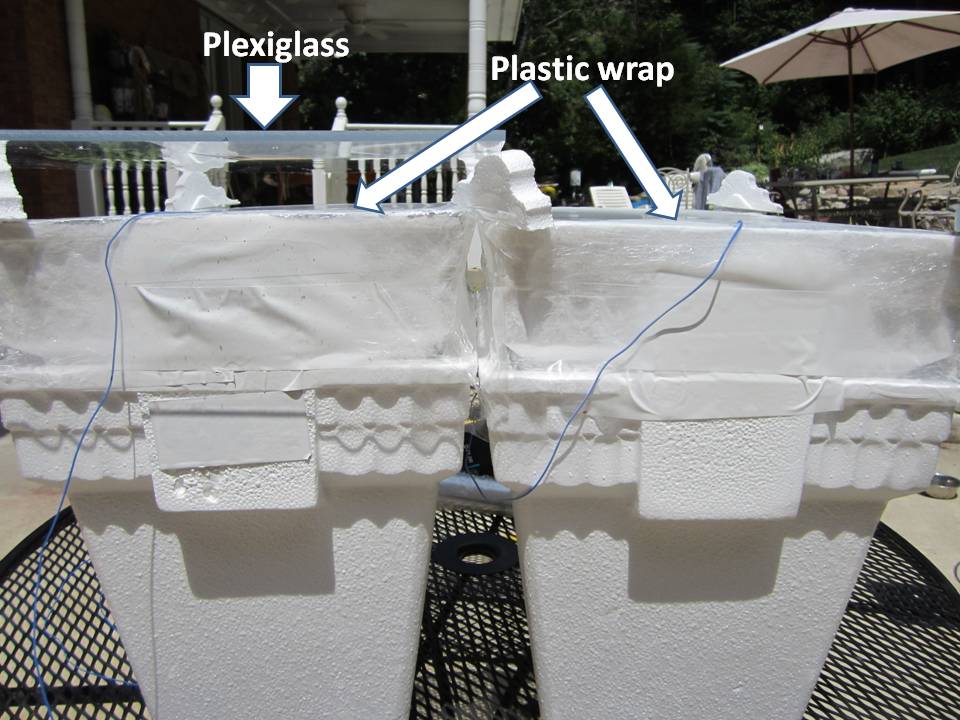
Both boxes were covered with kitchen plastic wrap (0.5 mil polyethylene), which is approximately 90% transparent to IR. Both coverings are sealed around their periphery with clear packing tape to make the boxes approximately air-tight. A sheet of 0.22 in thick plexiglass was placed about 1 inch above one of the boxes:
The first thing I discovered is that, without the plexiglass, it was difficult to get the two boxes to run at the same temperature, one being a little warmer (by 5 deg. F or more) as see in the thermal imager photo:
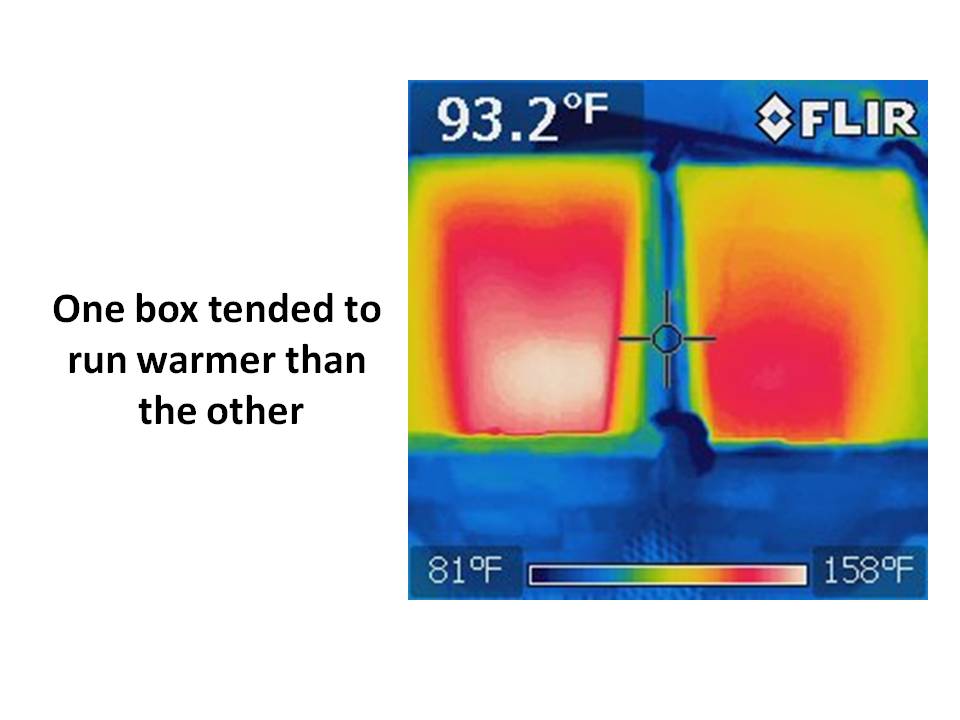
I believe this was the result of the spray paint…the warmer one had a slightly more textured painted surface, slightly darker in appearance (and thus absorbing more sunlight) while the cooler box had somewhat smoother paint, with a slightly brighter appearance.
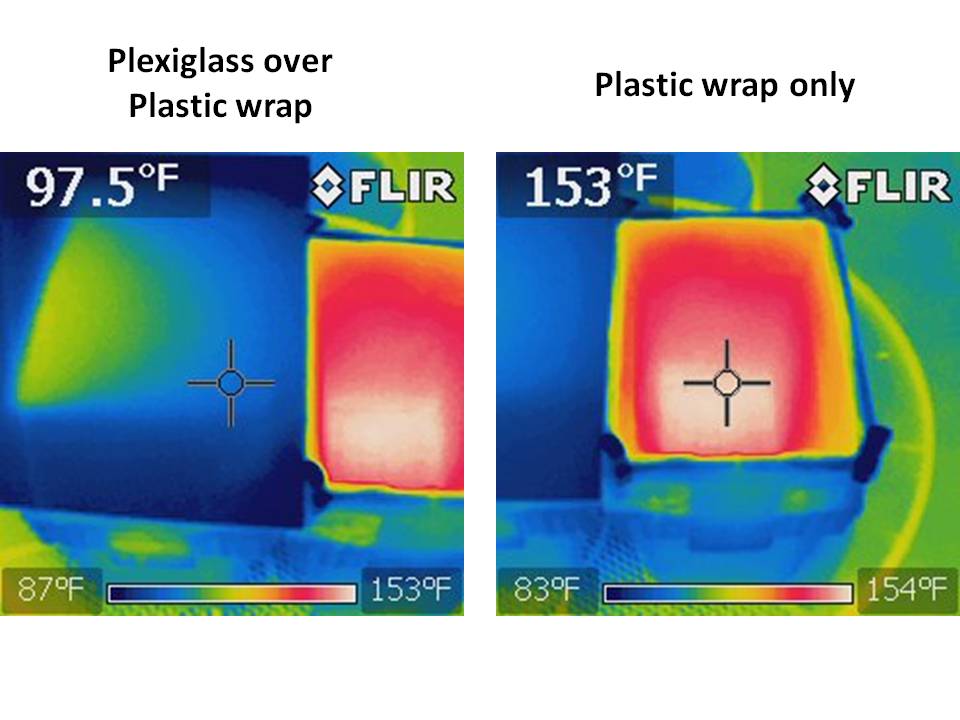
The effect of the plexiglass is to block the IR coming out of the box, as is clearly seen in the following FLIR images of the two boxes, where the one on the left has the plexiglass sitting above the plastic wrap (indicated temperatures are for the crosshair locations):
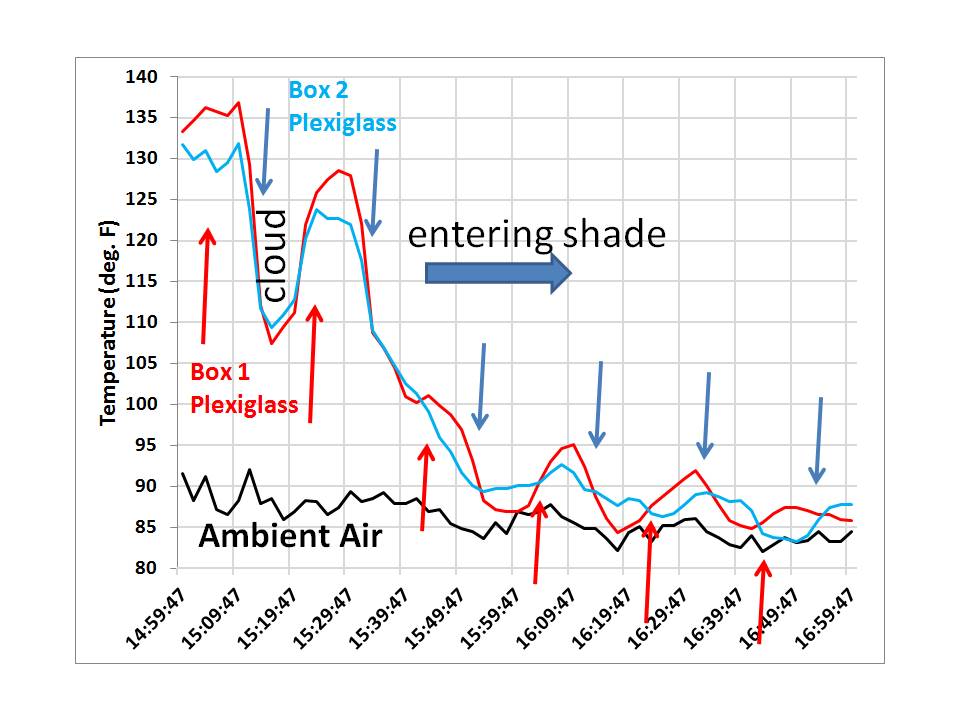
After monitoring temperatures and deciding that one box was going to run a little warmer even without the plexiglass present, I decided the best way to see if the plexiglass caused IR warming was to place it over one box, then over the other box, switching boxes every 10 minutes. I figured I would then see how the temperature difference between the two boxes changed as a result. I did this for 2 hours, from 3 p.m. until 5 p.m., with the following temperature readings taken every 2 minutes (gridlines, not the arrows, indicate when the plexiglass was swapped):
The effect of the plexiglass can then be most clearly seen when we then plot the temperature difference between the two boxes over that 2 hour period:
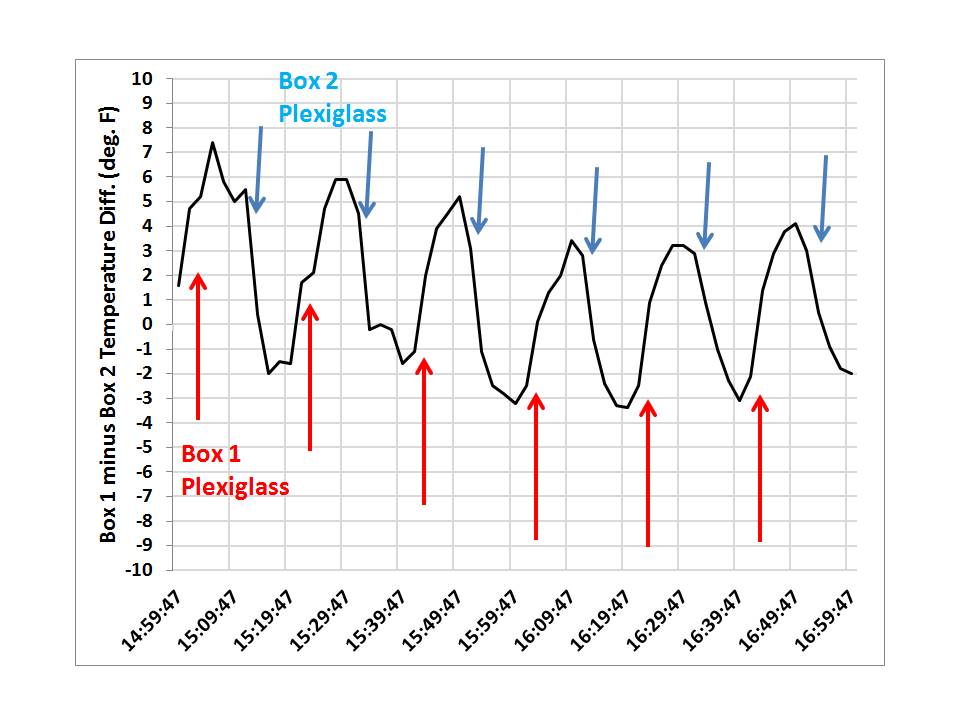
Now we clearly see the warming effect of the plexiglass. Even though the plexiglass only passes 92% of the visible sunlight, which by itself should cause cooler temperatures, its presence over one box causes that box to warm relative to the other box (or, you can say its absence causes the other box to run cooler).
This is how the “greenhouse effect” works. Even though the plexiglass is at a cooler temperature than the inside of either of the 2 boxes (just as the atmosphere is at a cooler temperature than the solar-heated surface of the Earth), its presence causes warmer temperatures in the box it is placed over.
I don’t believe this is being caused by suppression of convective heat loss from the plastic wrap because I had considerable air space under the plexiglass and there was a light breeze ventilating that air (see UPDATE, below).
Of course, there are many different ways the experiment could be structured. I could have used black paint instead of white, which would have caused higher temperatures, but I wanted the experiment to produce temperatures closer to those seen naturally. I hope that there is enough detail above for others to replicate what I have done, if they wanted to.
Finally, it should be mentioned that using an experiment like this to demonstrate the fundamental mechanism of the greenhouse effect is somewhat difficult because one is trying to produce a marginally increased greenhouse effect over that which is already present. The sky is already largely opaque to the transfer of IR radiation, and so such an experiment tries to measure the incremental warming effect of a solid surface (the plexiglass) over and above that already being produced by downwelling IR from the sky.
UPDATE: Since there is concern expressed that the plexiglass might be inhibiting convective heat loss from the top of whichever box it is placed over (even through there is a 1+” inch air space for ventilation), here are the temperatures of the two boxes from last evening (during which I swapped the plexiglass a couple of times) and during the night:
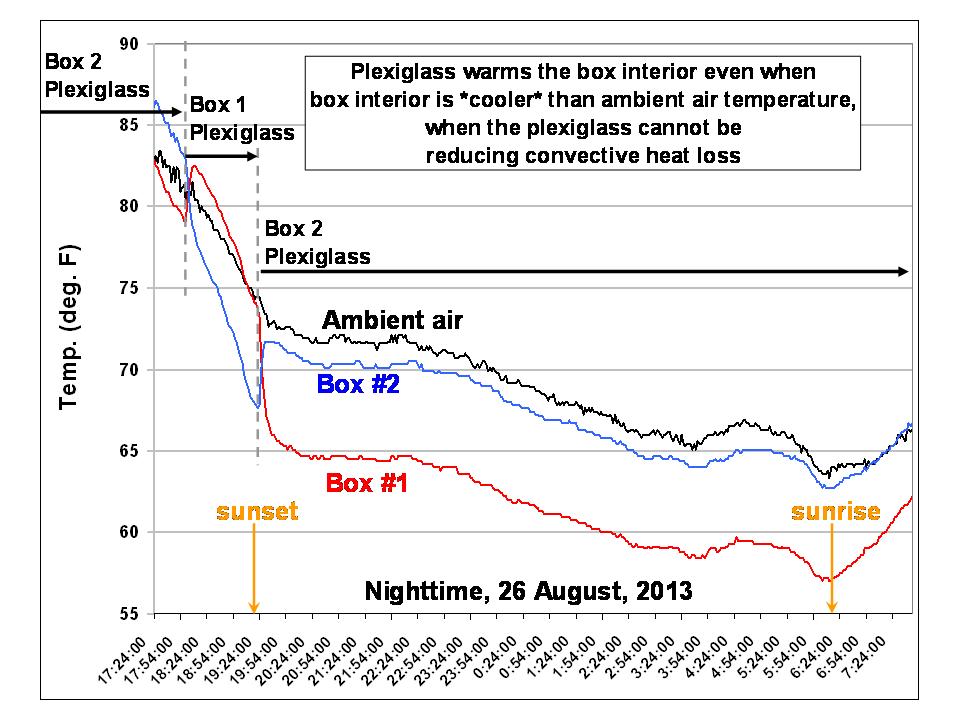
Importantly, note that even when the interior of the box is cooler than the ambient temperature, the plexiglass has a warming influence. This is better revealed in a plot of the temperature difference between Box 1 and the ambient air temperature:
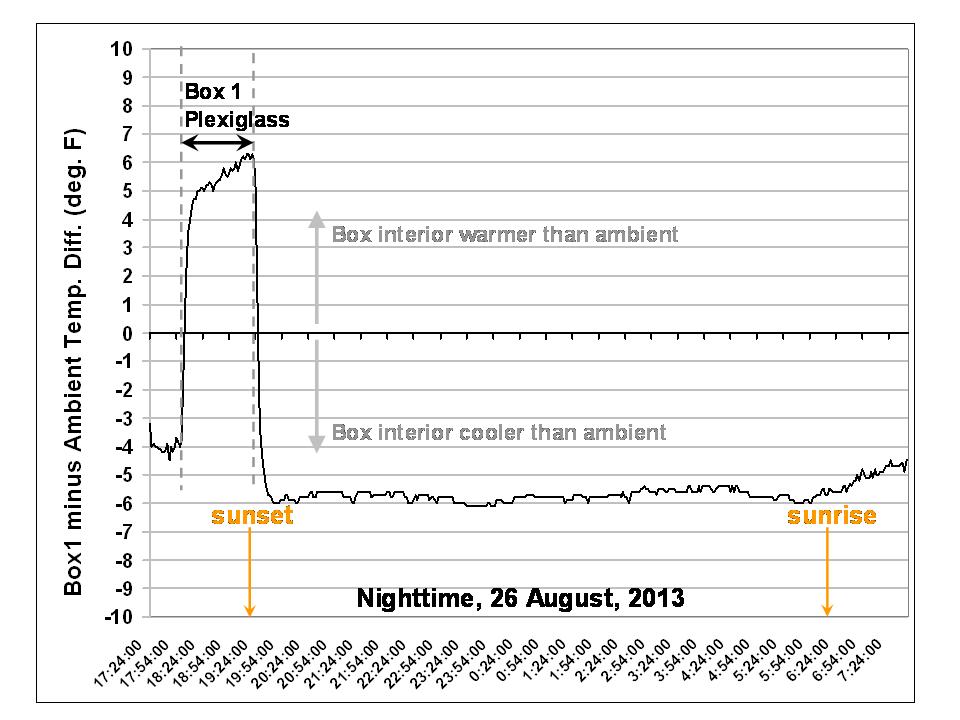
So, since convection can only transport heat from warmer to colder temperatures, convective inhibition cannot explain the warming effect of the plexiglass. It must be an infrared effect.