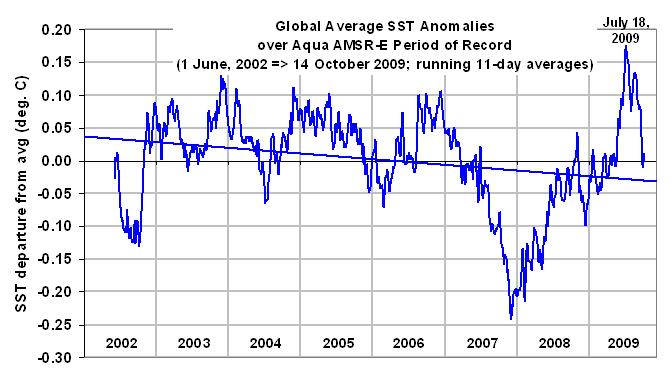
Since the global average sea surface temperature (SST) anomalies (departures from average) hit a peak a couple of months ago, I thought it would be a good time to see how they are progressing. Here’s a plot of running 11-day SST anomalies for the global oceans (60N to 60S latitude):

As can be seen, at least for the time being, temperatures have returned to the long-term average. Of course, this says nothing about what will happen in the future. I have also plotted the linear trend line, which is for entertainment purposes only.
The SSTs come from the AMSR-E instrument on NASA’s Aqua satellite, and are computed and archived at Remote Sensing Systems (Frank Wentz). I believe them to be the most precise record of subtle SST changes available, albeit only since mid-2002.

 Home/Blog


