UPDATE (4:00 p.m. Jan. 4): I’ve determined that the warm January 2010 anomaly IS consistent with AMSR-E sea surface temperatures from NASA’s Aqua satellite…I will post details later tonight or in the a.m. – Roy
YR MON GLOBE NH SH TROPICS
2009 01 +0.304 +0.443 +0.165 -0.036
2009 02 +0.347 +0.678 +0.016 +0.051
2009 03 +0.206 +0.310 +0.103 -0.149
2009 04 +0.090 +0.124 +0.056 -0.014
2009 05 +0.045 +0.046 +0.044 -0.166
2009 06 +0.003 +0.031 -0.025 -0.003
2009 07 +0.411 +0.212 +0.610 +0.427
2009 08 +0.229 +0.282 +0.177 +0.456
2009 09 +0.422 +0.549 +0.294 +0.511
2009 10 +0.286 +0.274 +0.297 +0.326
2009 11 +0.497 +0.422 +0.572 +0.495
2009 12 +0.288 +0.329 +0.246 +0.510
2010 01 +0.724 +0.841 +0.607 +0.757
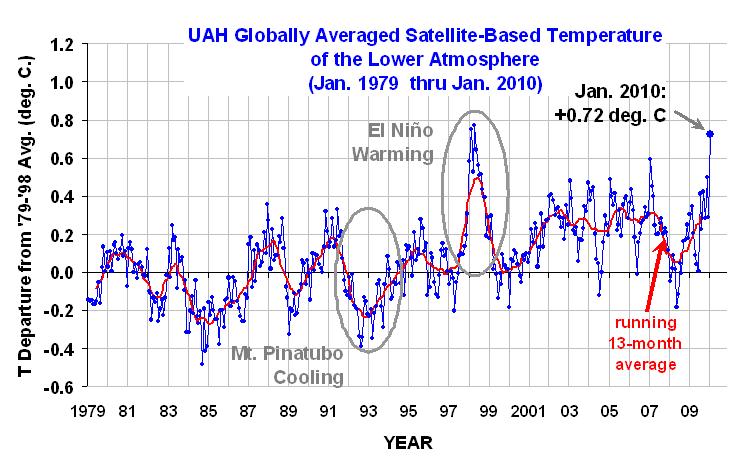
The global-average lower tropospheric temperature anomaly soared to +0.72 deg. C in January, 2010. This is the warmest January in the 32-year satellite-based data record.
The tropics and Northern and Southern Hemispheres were all well above normal, especially the tropics where El Nino conditions persist. Note the global-average warmth is approaching the warmth reached during the 1997-98 El Nino, which peaked in February April of 1998.
This record warmth will seem strange to those who have experienced an unusually cold winter. While I have not checked into this, my first guess is that the atmospheric general circulation this winter has become unusually land-locked, allowing cold air masses to intensify over the major Northern Hemispheric land masses more than usual. Note this ALSO means that not as much cold air is flowing over and cooling the ocean surface compared to normal. Nevertheless, we will double check our calculations to make sure we have not make some sort of Y2.01K error (insert smiley). I will also check the AMSR-E sea surface temperatures, which have also been running unusually warm.
After last month’s accusations that I’ve been ‘hiding the incline’ in temperatures, I’ve gone back to also plotting the running 13-month averages, rather than 25-month averages, to smooth out some of the month-to-month variability.
We don’t hide the data or use tricks, folks…it is what it is.
[NOTE: These satellite measurements are not calibrated to surface thermometer data in any way, but instead use on-board redundant precision platinum resistance thermometers (PRTs) carried on the satellite radiometers. The PRT’s are individually calibrated in a laboratory before being installed in the instruments.]

 Home/Blog


