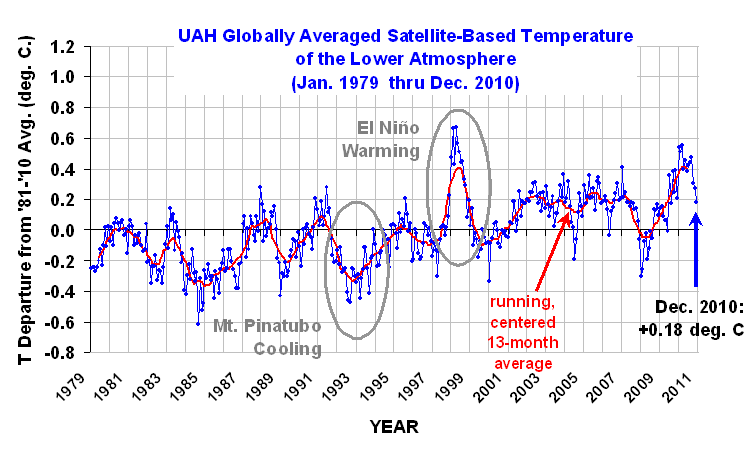
UPDATE #1(1/3/10, 2:50 p.m. CST): Graph fixed…it was missing Dec. 2010.
UPDATE #2(1/3/10, 3:25 p.m. CST): Appended global sea surface temperature anomalies from AMSR-E.
NEW 30-YEAR BASE PERIOD IMPLEMENTED!
YR MON GLOBE NH SH TROPICS
2010 1 0.542 0.675 0.410 0.635
2010 2 0.510 0.553 0.466 0.759
2010 3 0.554 0.665 0.443 0.721
2010 4 0.400 0.606 0.193 0.633
2010 5 0.454 0.642 0.265 0.706
2010 6 0.385 0.482 0.287 0.485
2010 7 0.419 0.558 0.280 0.370
2010 8 0.441 0.579 0.304 0.321
2010 9 0.477 0.410 0.545 0.237
2010 10 0.306 0.257 0.356 0.106
2010 11 0.273 0.372 0.173 -0.117
2010 12 0.180 0.213 0.147 -0.221
NEW 30-YEAR BASE PERIOD IMPLEMENTED!
Sorry for yelling like that, but if you have been following our global tropospheric temperature updates every month, you will have to re-calibrate your brains because we have just switched from a 20 year base period (1979 – 1998) to a more traditional 30 year base period (1981-2010) like that NOAA uses for climate “normals”.
This change from a 20 to a 30 year base period has 2 main impacts:
1) because the most recent decade averaged somewhat warmer than the previous two decades, the anomaly values will be about 0.1 deg. C lower than they used to be. This does NOT affect the long-term trend of the data…it only reflects a change in the zero-level, which is somewhat arbitrary.
2) the 30-year average annual cycle shape will be somewhat different, and more representative of “normal” of the satellite record than with 20 years; as a result, the month-to-month changes in the anomalies might be slightly less “erratic” in appearance. (Some enterprising person should check into that with the old versus new anomaly datasets).
Note that the tropics continue to cool as a result of the La Nina still in progress, and the Northern Hemisphere also cooled in December, more consistent with the anecdotal evidence. 🙂
I will provide a global sea surface temperature update later today.
WHO WINS THE RACE FOR WARMEST YEAR?
As far as the race for warmest year goes, 1998 (+0.424 deg. C) barely edged out 2010 (+0.411 deg. C), but the difference (0.01 deg. C) is nowhere near statistically significant. So feel free to use or misuse those statistics to your heart’s content.
THE DISCOVER WEBSITE: NOAA-15 PROBLEMS STARTING IN MID-DECEMBER
For those tracking our daily updates of global temperatures at the Discover website, remember that only 2 “channels” can be trusted for comparing different years to each other, both being the only ones posted there from NASA’s Aqua satellite:
1) only ch. 5 data should be used for tracking tropospheric temperatures,
2) the global-average “sea surface” temperatures are from AMSR-E on Aqua, and should be accurate.
The rest of the channels come from the AMSU on the 12 year old NOAA-15 satellite, WHICH IS NOW EXPERIENCING LARGE AMOUNTS OF MISSING DATA AS OF AROUND DECEMBER 20, 2010. This is why some of you have noted exceptionally large temperature changes in late December. While we wait for NOAA to investigate, it seems like more than coincidence that the NOAA-15 AMSU status report had a December 17 notice that the AMSU scan motor position was being reported incorrectly due to a bit error.
The notice says that problem has been sporadic, but increasing over time as has the amount of missing data I have seen during my processing. At this early stage, I am guessing that the processing software cannot determine which direction the instrument is pointing when making its measurements, and so the data from the radiometer are not being processed.
The daily NOAA-15 AMSU imagery available at the Discover website shows that the data loss is much more in the Northern Hemisphere than the Southern Hemisphere, which suggests that the temperature of the instrument is probably involved in the bit error rate. But at this point, this is all my speculation, based upon my past experience studying how the temperature of these instruments vary throughout the orbit as the solar illumination of the spacecraft varies.
SST UPDATE FROM AMSR-E
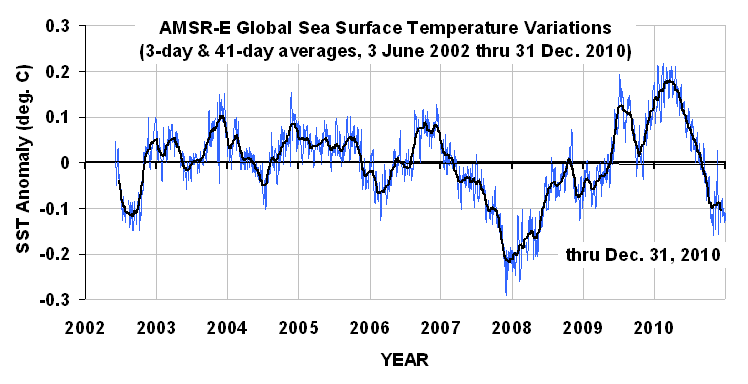
The following plot shows global average sea surface temperatures from the AMSR-E instrument over the lifetime of the Aqua satellite, through Dec 31, 2010. The SSTs at the end of December suggest that the tropospheric temperatures in the previous graph (above) still have a ways to fall in the coming months to catch up to the ocean, which should now be approaching its coolest point if it follows the course of previous La Nina’s.

 |

 Home/Blog


